
Mandarin Oriental International (SGX:M04) May Have Issues Allocating Its Capital
Mandarin Oriental International (SGX:M04) May Have Issues Allocating Its Capital
To find a multi-bagger stock, what are the underlying trends we should look for in a business? Firstly, we'll want to see a proven return on capital employed (ROCE) that is increasing, and secondly, an expanding base of capital employed. If you see this, it typically means it's a company with a great business model and plenty of profitable reinvestment opportunities. However, after investigating Mandarin Oriental International (SGX:M04), we don't think it's current trends fit the mold of a multi-bagger.
要找到一隻多袋裝箱的股票,我們應該在企業中尋找哪些潛在趨勢?首先,我們希望看到經過驗證的 返回 關於正在增加的資本使用率(ROCE),其次是擴大 基礎 所用資本的百分比。如果你看到這一點,那通常意味着它是一家擁有良好商業模式和大量盈利再投資機會的公司。但是,經過調查 文華東方國際 (SGX: M04),我們認爲它目前的趨勢不符合多功能裝袋機的模式。
Understanding Return On Capital Employed (ROCE)
了解資本使用回報率 (ROCE)
For those that aren't sure what ROCE is, it measures the amount of pre-tax profits a company can generate from the capital employed in its business. The formula for this calculation on Mandarin Oriental International is:
對於那些不確定ROCE是什麼的人,它衡量的是公司從業務中使用的資本中可以產生的稅前利潤。文華東方國際酒店的計算公式爲:
Return on Capital Employed = Earnings Before Interest and Tax (EBIT) ÷ (Total Assets - Current Liabilities)
使用資本回報率 = 利息和稅前收益 (EBIT) ÷(總資產-流動負債)
0.019 = US$65m ÷ (US$4.2b - US$759m) (Based on the trailing twelve months to June 2023).
0.019 = 6500 萬美元 ⇒(42 億美元至 7.59 億美元) (基於截至 2023 年 6 月的過去十二個月)。
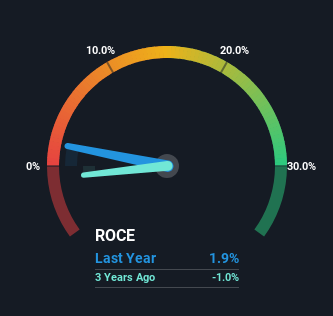
Thus, Mandarin Oriental International has an ROCE of 1.9%. In absolute terms, that's a low return and it also under-performs the Hospitality industry average of 3.9%.
因此, 文華東方國際的投資回報率爲1.9%。 從絕對值來看,這是一個低迴報,而且表現也低於酒店業3.9%的平均水平。
Check out our latest analysis for Mandarin Oriental International
查看我們對文華東方國際酒店的最新分析
While the past is not representative of the future, it can be helpful to know how a company has performed historically, which is why we have this chart above. If you're interested in investigating Mandarin Oriental International's past further, check out this free graph of past earnings, revenue and cash flow.
雖然過去不能代表未來,但了解一家公司的歷史表現可能會有所幫助,這就是我們上面有這張圖表的原因。如果你有興趣進一步調查文華東方國際的過去,請看看這個 免費的 過去的收益、收入和現金流圖。
What The Trend Of ROCE Can Tell Us
ROCE 的趨勢能告訴我們什麼
On the surface, the trend of ROCE at Mandarin Oriental International doesn't inspire confidence. Around five years ago the returns on capital were 4.5%, but since then they've fallen to 1.9%. Although, given both revenue and the amount of assets employed in the business have increased, it could suggest the company is investing in growth, and the extra capital has led to a short-term reduction in ROCE. And if the increased capital generates additional returns, the business, and thus shareholders, will benefit in the long run.
從表面上看,文華東方國際集團的投資回報率趨勢並不能激發信心。大約五年前,資本回報率爲4.5%,但此後已降至1.9%。儘管鑑於收入和業務使用的資產數量均有所增加,這可能表明該公司正在投資增長,而額外的資本導致了投資回報率的短期下降。而且,如果增加的資本產生額外的回報,那麼從長遠來看,企業乃至股東都將受益。
The Bottom Line
底線
Even though returns on capital have fallen in the short term, we find it promising that revenue and capital employed have both increased for Mandarin Oriental International. And there could be an opportunity here if other metrics look good too, because the stock has declined 15% in the last five years. So we think it'd be worthwhile to look further into this stock given the trends look encouraging.
儘管短期內資本回報率有所下降,但我們認爲文華東方國際的收入和資本使用量都有所增加,這令人鼓舞。如果其他指標也看起來不錯,那麼這裏可能會有機會,因爲該股在過去五年中下跌了15%。因此,鑑於趨勢令人鼓舞,我們認爲值得進一步研究這隻股票。
If you want to continue researching Mandarin Oriental International, you might be interested to know about the 1 warning sign that our analysis has discovered.
如果你想繼續研究文華東方國際,你可能有興趣了解 1 個警告標誌 我們的分析已經發現了這一點。
While Mandarin Oriental International isn't earning the highest return, check out this free list of companies that are earning high returns on equity with solid balance sheets.
雖然文華東方國際的回報率不高,但請看看這個 免費的 資產負債表穩健且股本回報率高的公司名單。
Have feedback on this article? Concerned about the content? Get in touch with us directly. Alternatively, email editorial-team (at) simplywallst.com.
This article by Simply Wall St is general in nature. We provide commentary based on historical data and analyst forecasts only using an unbiased methodology and our articles are not intended to be financial advice. It does not constitute a recommendation to buy or sell any stock, and does not take account of your objectives, or your financial situation. We aim to bring you long-term focused analysis driven by fundamental data. Note that our analysis may not factor in the latest price-sensitive company announcements or qualitative material. Simply Wall St has no position in any stocks mentioned.
對這篇文章有反饋嗎?擔心內容嗎? 取得聯繫 直接和我們在一起。 或者,給編輯團隊 (at) simplywallst.com 發送電子郵件。
Simply Wall St的這篇文章本質上是籠統的。 我們僅使用公正的方法根據歷史數據和分析師的預測提供評論,我們的文章無意作爲財務建議。 它不構成買入或賣出任何股票的建議,也沒有考慮您的目標或財務狀況。我們的目標是爲您提供由基本面數據驅動的長期重點分析。請注意,我們的分析可能不考慮最新的價格敏感公司公告或定性材料。簡而言之,華爾街在上述任何股票中都沒有頭寸。
譯文內容由第三人軟體翻譯。