
The external fund manager backed by Berkshire Hathaway's Charlie Munger, Li Lu, makes no bones about it when he says 'The biggest investment risk is not the volatility of prices, but whether you will suffer a permanent loss of capital.' It's only natural to consider a company's balance sheet when you examine how risky it is, since debt is often involved when a business collapses. We can see that Nanjing Kangni Mechanical & Electrical Co.,Ltd (SHSE:603111) does use debt in its business. But is this debt a concern to shareholders?
Why Does Debt Bring Risk?
Debt and other liabilities become risky for a business when it cannot easily fulfill those obligations, either with free cash flow or by raising capital at an attractive price. In the worst case scenario, a company can go bankrupt if it cannot pay its creditors. However, a more frequent (but still costly) occurrence is where a company must issue shares at bargain-basement prices, permanently diluting shareholders, just to shore up its balance sheet. By replacing dilution, though, debt can be an extremely good tool for businesses that need capital to invest in growth at high rates of return. When we think about a company's use of debt, we first look at cash and debt together.
Check out our latest analysis for Nanjing Kangni Mechanical & ElectricalLtd
What Is Nanjing Kangni Mechanical & ElectricalLtd's Debt?
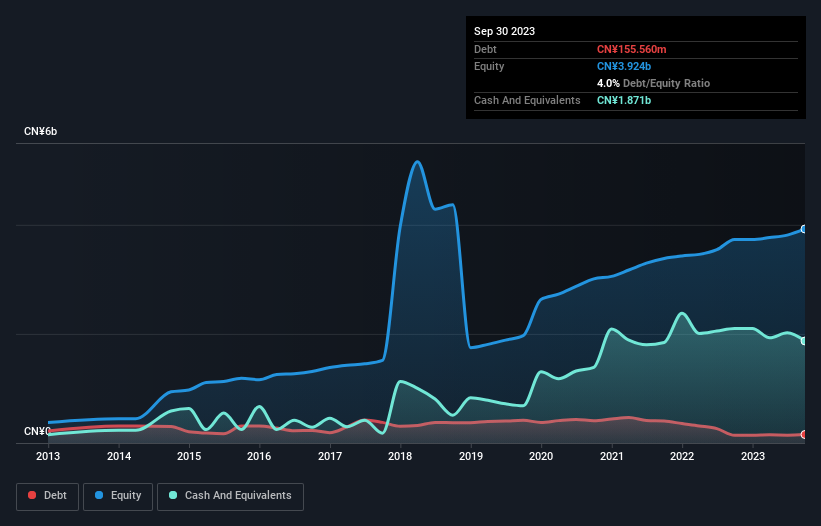
You can click the graphic below for the historical numbers, but it shows that as of September 2023 Nanjing Kangni Mechanical & ElectricalLtd had CN¥155.6m of debt, an increase on CN¥140.1m, over one year. But on the other hand it also has CN¥1.87b in cash, leading to a CN¥1.72b net cash position.
How Healthy Is Nanjing Kangni Mechanical & ElectricalLtd's Balance Sheet?
Zooming in on the latest balance sheet data, we can see that Nanjing Kangni Mechanical & ElectricalLtd had liabilities of CN¥1.74b due within 12 months and liabilities of CN¥194.7m due beyond that. On the other hand, it had cash of CN¥1.87b and CN¥2.70b worth of receivables due within a year. So it actually has CN¥2.63b more liquid assets than total liabilities.
This excess liquidity is a great indication that Nanjing Kangni Mechanical & ElectricalLtd's balance sheet is almost as strong as Fort Knox. With this in mind one could posit that its balance sheet means the company is able to handle some adversity. Simply put, the fact that Nanjing Kangni Mechanical & ElectricalLtd has more cash than debt is arguably a good indication that it can manage its debt safely.
On the other hand, Nanjing Kangni Mechanical & ElectricalLtd saw its EBIT drop by 7.4% in the last twelve months. That sort of decline, if sustained, will obviously make debt harder to handle. There's no doubt that we learn most about debt from the balance sheet. But it is Nanjing Kangni Mechanical & ElectricalLtd's earnings that will influence how the balance sheet holds up in the future. So if you're keen to discover more about its earnings, it might be worth checking out this graph of its long term earnings trend.
Finally, a company can only pay off debt with cold hard cash, not accounting profits. Nanjing Kangni Mechanical & ElectricalLtd may have net cash on the balance sheet, but it is still interesting to look at how well the business converts its earnings before interest and tax (EBIT) to free cash flow, because that will influence both its need for, and its capacity to manage debt. Over the last three years, Nanjing Kangni Mechanical & ElectricalLtd actually produced more free cash flow than EBIT. That sort of strong cash generation warms our hearts like a puppy in a bumblebee suit.
Summing Up
While it is always sensible to investigate a company's debt, in this case Nanjing Kangni Mechanical & ElectricalLtd has CN¥1.72b in net cash and a decent-looking balance sheet. The cherry on top was that in converted 115% of that EBIT to free cash flow, bringing in CN¥176m. So we don't think Nanjing Kangni Mechanical & ElectricalLtd's use of debt is risky. Above most other metrics, we think its important to track how fast earnings per share is growing, if at all. If you've also come to that realization, you're in luck, because today you can view this interactive graph of Nanjing Kangni Mechanical & ElectricalLtd's earnings per share history for free.
If, after all that, you're more interested in a fast growing company with a rock-solid balance sheet, then check out our list of net cash growth stocks without delay.
Have feedback on this article? Concerned about the content? Get in touch with us directly. Alternatively, email editorial-team (at) simplywallst.com.
This article by Simply Wall St is general in nature. We provide commentary based on historical data and analyst forecasts only using an unbiased methodology and our articles are not intended to be financial advice. It does not constitute a recommendation to buy or sell any stock, and does not take account of your objectives, or your financial situation. We aim to bring you long-term focused analysis driven by fundamental data. Note that our analysis may not factor in the latest price-sensitive company announcements or qualitative material. Simply Wall St has no position in any stocks mentioned.