
Key Insights
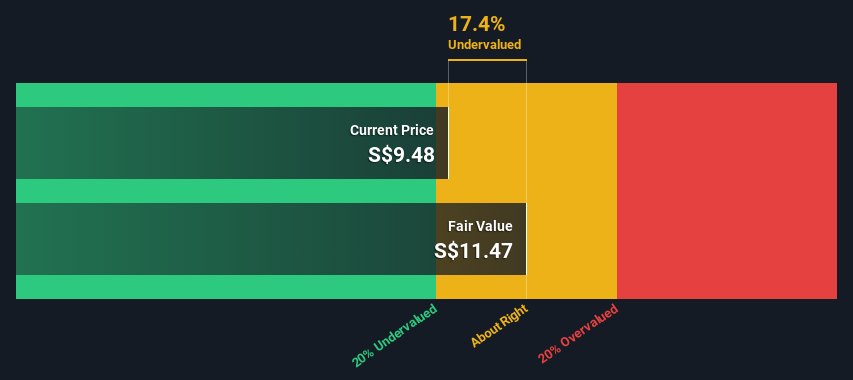
- Haw Par's estimated fair value is S$11.47 based on 2 Stage Free Cash Flow to Equity
- Current share price of S$9.48 suggests Haw Par is potentially trading close to its fair value
- The average premium for Haw Par's competitorsis currently 185%
In this article we are going to estimate the intrinsic value of Haw Par Corporation Limited (SGX:H02) by taking the expected future cash flows and discounting them to their present value. We will use the Discounted Cash Flow (DCF) model on this occasion. Models like these may appear beyond the comprehension of a lay person, but they're fairly easy to follow.
Remember though, that there are many ways to estimate a company's value, and a DCF is just one method. If you want to learn more about discounted cash flow, the rationale behind this calculation can be read in detail in the Simply Wall St analysis model.
See our latest analysis for Haw Par
The Model
We're using the 2-stage growth model, which simply means we take in account two stages of company's growth. In the initial period the company may have a higher growth rate and the second stage is usually assumed to have a stable growth rate. In the first stage we need to estimate the cash flows to the business over the next ten years. Seeing as no analyst estimates of free cash flow are available to us, we have extrapolate the previous free cash flow (FCF) from the company's last reported value. We assume companies with shrinking free cash flow will slow their rate of shrinkage, and that companies with growing free cash flow will see their growth rate slow, over this period. We do this to reflect that growth tends to slow more in the early years than it does in later years.
A DCF is all about the idea that a dollar in the future is less valuable than a dollar today, so we need to discount the sum of these future cash flows to arrive at a present value estimate:
10-year free cash flow (FCF) estimate
| 2024 | 2025 | 2026 | 2027 | 2028 | 2029 | 2030 | 2031 | 2032 | 2033 | |
| Levered FCF (SGD, Millions) | S$46.6m | S$61.3m | S$75.1m | S$87.5m | S$98.0m | S$106.9m | S$114.3m | S$120.5m | S$125.8m | S$130.4m |
| Growth Rate Estimate Source | Est @ 44.03% | Est @ 31.41% | Est @ 22.58% | Est @ 16.40% | Est @ 12.08% | Est @ 9.05% | Est @ 6.93% | Est @ 5.44% | Est @ 4.40% | Est @ 3.68% |
| Present Value (SGD, Millions) Discounted @ 6.0% | S$44.0 | S$54.6 | S$63.1 | S$69.3 | S$73.3 | S$75.4 | S$76.1 | S$75.7 | S$74.6 | S$73.0 |
("Est" = FCF growth rate estimated by Simply Wall St)
Present Value of 10-year Cash Flow (PVCF) = S$679m
The second stage is also known as Terminal Value, this is the business's cash flow after the first stage. The Gordon Growth formula is used to calculate Terminal Value at a future annual growth rate equal to the 5-year average of the 10-year government bond yield of 2.0%. We discount the terminal cash flows to today's value at a cost of equity of 6.0%.
Terminal Value (TV)= FCF2033 × (1 + g) ÷ (r – g) = S$130m× (1 + 2.0%) ÷ (6.0%– 2.0%) = S$3.3b
Present Value of Terminal Value (PVTV)= TV / (1 + r)10= S$3.3b÷ ( 1 + 6.0%)10= S$1.9b
The total value is the sum of cash flows for the next ten years plus the discounted terminal value, which results in the Total Equity Value, which in this case is S$2.5b. The last step is to then divide the equity value by the number of shares outstanding. Relative to the current share price of S$9.5, the company appears about fair value at a 17% discount to where the stock price trades currently. Valuations are imprecise instruments though, rather like a telescope - move a few degrees and end up in a different galaxy. Do keep this in mind.
Important Assumptions
Now the most important inputs to a discounted cash flow are the discount rate, and of course, the actual cash flows. Part of investing is coming up with your own evaluation of a company's future performance, so try the calculation yourself and check your own assumptions. The DCF also does not consider the possible cyclicality of an industry, or a company's future capital requirements, so it does not give a full picture of a company's potential performance. Given that we are looking at Haw Par as potential shareholders, the cost of equity is used as the discount rate, rather than the cost of capital (or weighted average cost of capital, WACC) which accounts for debt. In this calculation we've used 6.0%, which is based on a levered beta of 0.800. Beta is a measure of a stock's volatility, compared to the market as a whole. We get our beta from the industry average beta of globally comparable companies, with an imposed limit between 0.8 and 2.0, which is a reasonable range for a stable business.
SWOT Analysis for Haw Par
- Earnings growth over the past year exceeded the industry.
- Debt is not viewed as a risk.
- Balance sheet summary for H02.
- Dividend is low compared to the top 25% of dividend payers in the Pharmaceuticals market.
- Current share price is below our estimate of fair value.
- Lack of analyst coverage makes it difficult to determine H02's earnings prospects.
- Dividends are not covered by cash flow.
- See H02's dividend history.
Moving On:
Whilst important, the DCF calculation ideally won't be the sole piece of analysis you scrutinize for a company. The DCF model is not a perfect stock valuation tool. Instead the best use for a DCF model is to test certain assumptions and theories to see if they would lead to the company being undervalued or overvalued. If a company grows at a different rate, or if its cost of equity or risk free rate changes sharply, the output can look very different. For Haw Par, there are three additional elements you should explore:
- Risks: Case in point, we've spotted 2 warning signs for Haw Par you should be aware of, and 1 of them is potentially serious.
- Other Solid Businesses: Low debt, high returns on equity and good past performance are fundamental to a strong business. Why not explore our interactive list of stocks with solid business fundamentals to see if there are other companies you may not have considered!
- Other Environmentally-Friendly Companies: Concerned about the environment and think consumers will buy eco-friendly products more and more? Browse through our interactive list of companies that are thinking about a greener future to discover some stocks you may not have thought of!
PS. The Simply Wall St app conducts a discounted cash flow valuation for every stock on the SGX every day. If you want to find the calculation for other stocks just search here.
Have feedback on this article? Concerned about the content? Get in touch with us directly. Alternatively, email editorial-team (at) simplywallst.com.
This article by Simply Wall St is general in nature. We provide commentary based on historical data and analyst forecasts only using an unbiased methodology and our articles are not intended to be financial advice. It does not constitute a recommendation to buy or sell any stock, and does not take account of your objectives, or your financial situation. We aim to bring you long-term focused analysis driven by fundamental data. Note that our analysis may not factor in the latest price-sensitive company announcements or qualitative material. Simply Wall St has no position in any stocks mentioned.