From January to September 2017, the country's new real estate construction area and investment volume increased by 6.8% and 8.1% year-on-year respectively, and sales area and value increased by 10.3% and 14.6% year-on-year respectively, in line with Bank of China International's expectations for the third quarter. Due to last year's high base figure and the recent tightening of housing credit, the housing sales growth rate continued to narrow. In September, the single-month transaction area growth rate turned negative for the first time, with a year-on-year decline of 1.5% and a year-on-year decline of 5.8 percentage points; in terms of investment, the new construction area of real estate continued to narrow. In September, the monthly construction growth rate increased 1.4% year on year, narrowing by 3.9 percentage points; however, due to the larger decline in completed area, the investment growth rate rebounded to 9.2%. In terms of capital, the monthly growth rate of deposits and prepayments was affected by regulations and turned negative for the first time. The growth rate of mortgage loans fell sharply by 50%, and the growth rate of capital received by housing enterprises in a single month also fell back to 1.2%.
According to a research report published by Bank of China International, the September real estate data is in line with previous judgments. Real estate investment in the construction industry has entered the peak construction season and there is a steady recovery in real estate investment. It is expected that the investment growth rate will continue in October, but it is expected to peak at the end of the year with declining sales payback.
Bank of China International maintains a “neutral” rating for the industry. Bank of China International believes that with the decline in transactions in third- and fourth-tier cities and the tightening of housing credit, it is inevitable that the industry will enter a cyclical decline.
Three factors support the rating
In January-September, the country's real estate development investment increased 8.1% year on year, up 0.2 percentage points from January-August; the new commercial housing construction area increased 6.8% year on year, down 0.8 percentage points from January-August; construction area increased 3.1% year on year, the growth rate remained the same as in January-August; and land purchase area increased 12.2% year on year. The monthly construction growth rate in September increased 1.4% year on year, which was 3.9 percentage points narrower than the previous month; however, due to the larger decline in completed area, the year-on-year decline of 17.2%, the growth rate of construction area under construction rebounded to 2.4%, an increase of 2.7 percentage points over the previous month, and the monthly investment growth rate also rebounded to 9.2%. On the other hand, the land purchase area increased by 26% over the same period last year, indicating that housing enterprises are still very willing to make up their inventories. The recovery in investment during the peak construction season in September is in line with Bank of China International's judgment. Inertia is expected to remain in October, but with the decline in cash payback on the sales side, the investment growth rate may peak at the end of the year.
The sales area of commercial housing in January-September was 116.06 million square meters, up 10.3% year on year; sales volume was 919.04 billion yuan, up 14.6% year on year; down 2.6 percentage points from the previous month; average sales price was 7,922 yuan/square meter, up 3.9% year on year, down 0.1 percentage points from last month. On the sales side, due to last year's high base and the tightening of housing credit, the housing sales growth rate continued to narrow. In September, the monthly transaction area growth rate turned negative for the first time, down 1.5% year on year, down 5.8 percentage points from the previous month; monthly sales increased 1.6% year on year and 4.8 percentage points narrower than last month. In addition, the operating data of major housing enterprises also showed that the sales volume for each month in September had turned negative year on year, indicating that the popularity of third- and fourth-tier cities had declined, and there was a clear downward trend in the property market sales cycle.
In January-September, the total capital source of real estate development enterprises was 11309.5 billion yuan, up 8% year on year and down 1 percentage point from January-August. Among them, the growth rate of domestic loans was 19.6%, an increase of 0.5 percentage points from the previous month, indicating a strong demand for financing from housing enterprises; self-financing fell 0.3% year on year, and was 1.4 percentage points narrower than the previous month, mainly due to the relaxation of housing enterprise bond financing and the increase in trust loans; the growth rate of deposit and prepayment was 16.9%, down 3.1 percentage points from the previous month, down 3.1 percentage points from the previous month. The growth rate of personal mortgage loans was 1.3%, down 1.1 percentage points from the previous month, and a sharp drop of 50% in a single month. Financial data released earlier also showed that the cumulative growth rate of medium- and long-term loans to new residents is close to 0, but short-term loans have surged by 191%. In the future, with the strict investigation of bank consumer loans, it is expected that the tightening of credit will continue to lead to a decline in sales growth.
Real estate development data analysis: investment rebounds, sales fall
Investment rebounded, land purchases rose
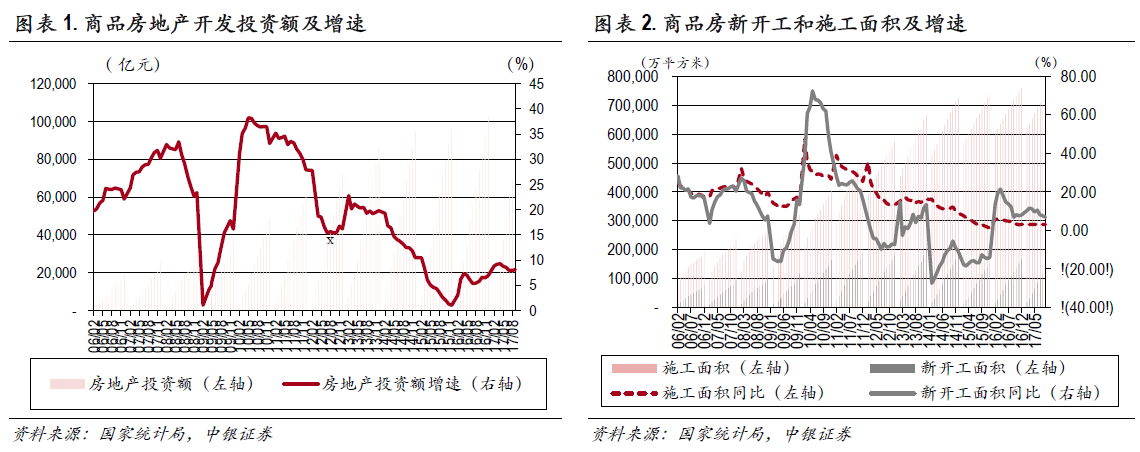
From January to September 2017, the country invested 8064.4 billion yuan in real estate development, an increase of 8.1% over the previous year and an increase of 0.2 percentage points over January-August. Among them, residential investment was 5510.9 billion yuan, up 10.4% year on year, up 0.2 percentage points from January-August, accounting for 68.3% of real estate development investment. In September, the country's real estate development investment increased 9.2% year on year in a single month.
Judging from leading supply indicators, the newly started area of commercial housing and residential housing in January-September rose 6.8% year on year and 11.1% respectively, down 0.8 percentage points and 0.5 percentage points from January-August, respectively. Among them, the newly started area of commercial housing and residential housing in September increased by 1.4% year on year and 7.8%, respectively. The construction area of commercial housing and residential buildings in January-September increased by 3.1% and 2.9% year-on-year respectively, down 0 percentage points and 0.1 percentage points from January-August, respectively. Among them, the construction area of commercial housing and residential housing increased by 2.4% and 8.8%, respectively, in a single month in September. The completed area of commercial housing and residential housing in January-September increased 1% year on year and fell 1.9%, respectively, down 2.3 percentage points and 2.4 percentage points from January-August, respectively. Among them, the completed area of commercial housing and residential housing in September fell 17.2% year on year and 20.3%, respectively.
Judging from land market indicators, the land purchase area in January-September was 157.33 million square meters, up 5.5% year on year, down 4.6 percentage points from January-August. Among them, the monthly land purchase area in September fell 24.6% year on year. Land transactions in January-September were 814.9 billion yuan, up 46.3% year on year; the average floor price of land transactions in January-September was 5180 yuan/square meter, up 38.7% year on year, up 9.2 percentage points from January-August.
 The National Housing Sentiment Index rose month-on-month
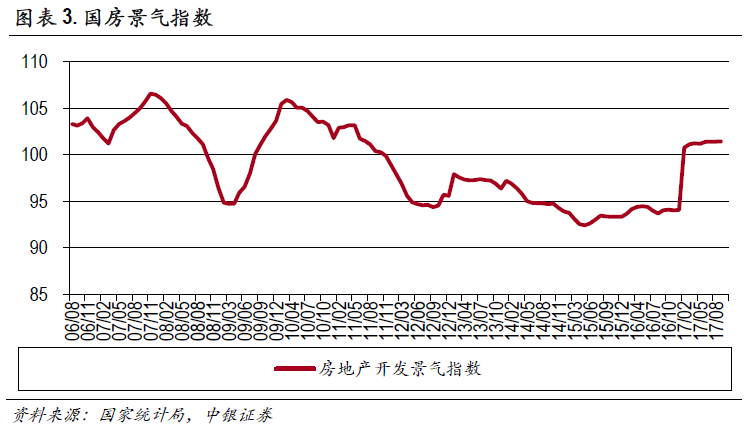
The national real estate development sentiment index for September was 101.44, up 0.29 from the previous month.
Sales continue the downward trend
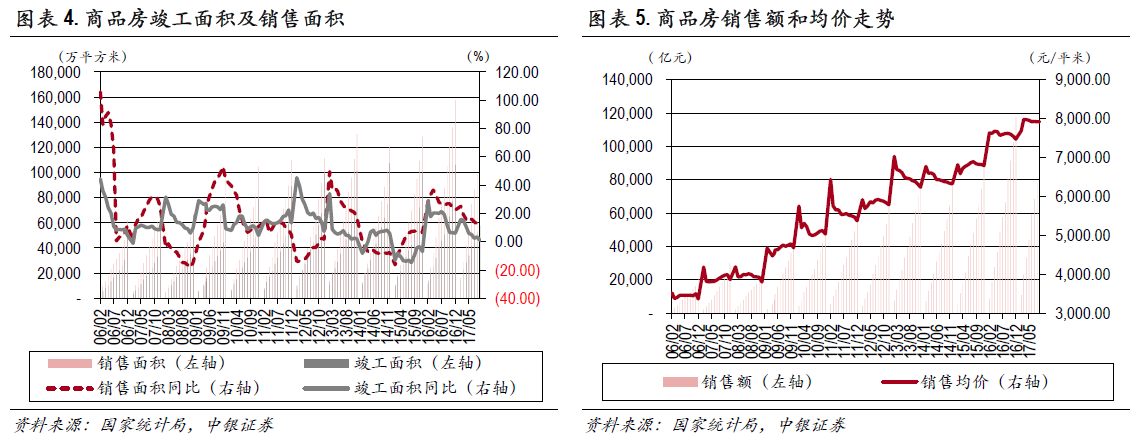
Judging from sales indicators, the sales area of commercial housing in January-September was 116.06 million square meters, up 10.3% year on year, down 2.4 percentage points from January-August. Among them, the monthly sales area in September fell 1.5% year on year. Commercial housing sales in January-September were 919.4 billion yuan, up 14.6% year on year; down 2.6 percentage points from January-August. Among them, monthly sales in September increased 1.6% year on year.
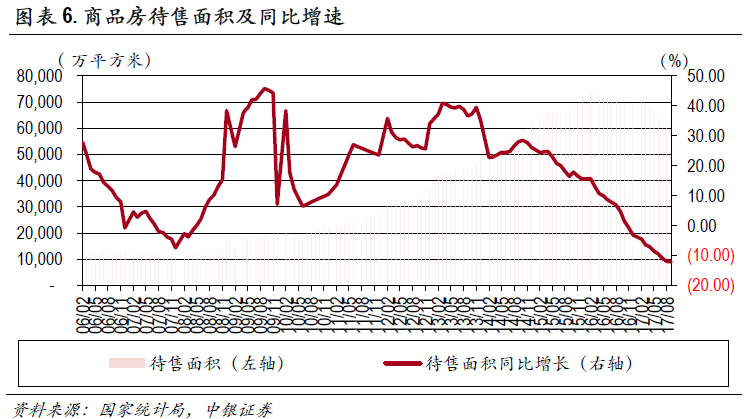
Judging from price indicators, the average sales price of commercial housing in January-September was 7,922 yuan/square meter, up 3.9% year on year and down 0.1 percentage points from January-August. Among them, the average monthly sales price in September fell 0% month-on-month. Judging from the inventory index, the area of commercial housing for sale at the end of September was 611.4 million square meters, a year-on-year decrease of 12.2%, a decrease of 12.12 million square meters from the end of August, of which the residential area for sale decreased by 9.38 million square meters.
The financing side of housing enterprises continues to be tightened
In January-September, the total capital source of real estate development enterprises was 11309.5 billion yuan, up 8% year on year and down 1 percentage point from January-August. Looking at various funding sources year on year, in the January-September cumulative data, domestic loans rose 19.6% year on year, up 0.5 percentage points from January-August; use of foreign capital remained flat at 0% year on year, down 15.5 percentage points from January-August; self-financing capital fell 0.3% year on year, down 1.4 percentage points from January-August; other funds, including deposits, advance payments and personal mortgage loans rose 10.4% year on year, down 3 percentage points from January-August. Among them, January-September deposits, advance payments, and personal mortgage loans rose 16.9% and 1.3% year-on-year respectively.
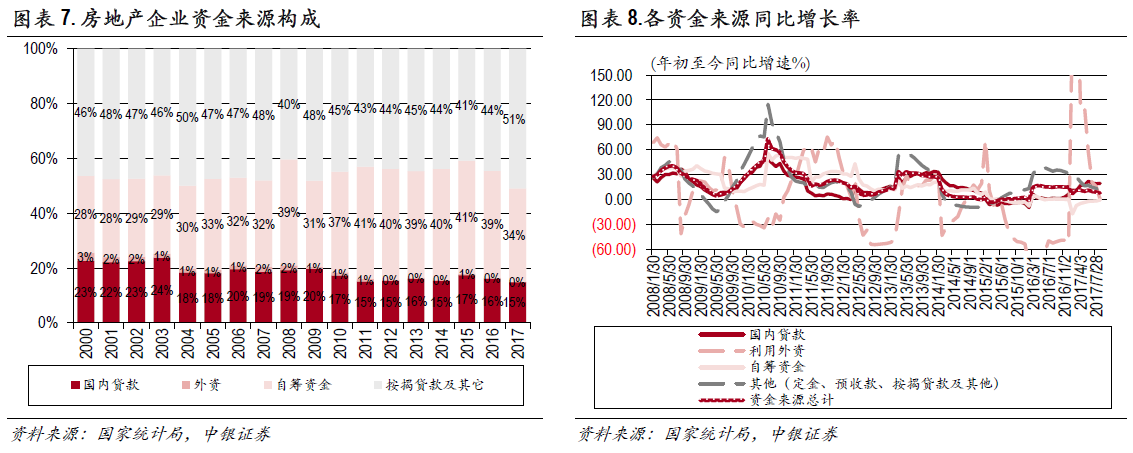
Land transaction data analysis: transaction growth rate declines
Land supply in the first nine months of the 40 cities rose 7.5% year on year, and land transactions rose 9.6% year on year
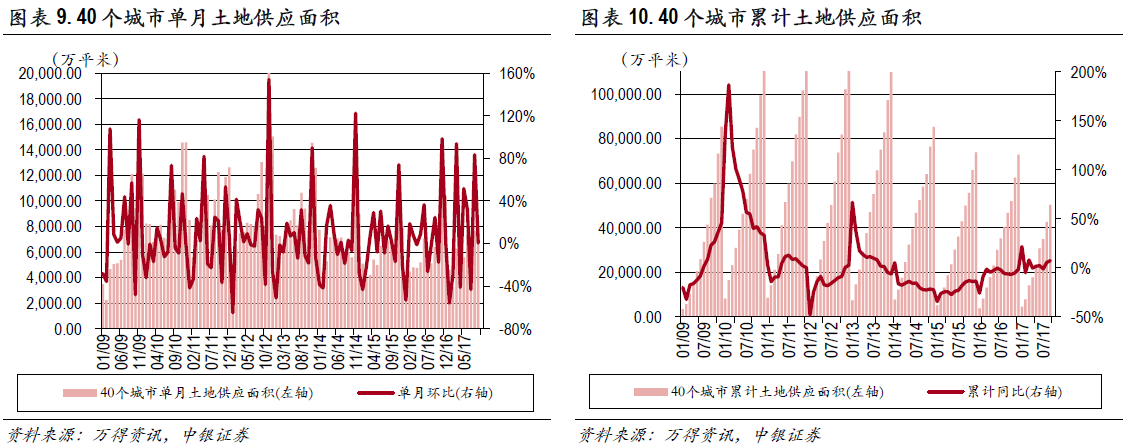
In terms of land supply, the monthly land push volume of 40 cities in September rose 0.5% month-on-month, up 20.6% year-on-year, and the cumulative year-on-year increase in January-September was 7.5%, up 2.1 percentage points from the previous month. Among them, first-tier cities rose 57% year on year on month, cumulative year-on-year increase of 102.2% year on year, second- and third-tier cities rose 17.2% year on month, and cumulative year-on-year increase of 1.3% year on year.
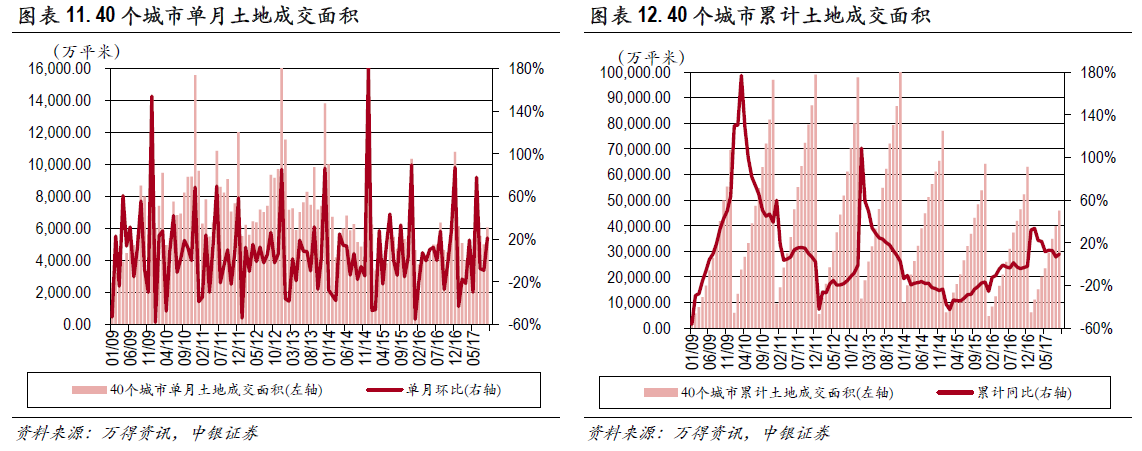
In terms of land turnover, the monthly land turnover in the 40 cities in September rose 21.3% month-on-month, up 30.9% year-on-year, and the cumulative year-on-year increase in January-September was 9.6%, up 2.7 percentage points from the previous month. Among them, the monthly turnover of first-tier cities increased 72.1% month-on-month and 191.9% year-on-year, with a cumulative year-on-year increase of 82.5%; an increase of 11.3 percentage points over the previous month. The monthly turnover of second-tier and third-tier cities rose 16.8% month-on-month and 22% year-on-year, with a cumulative year-on-year increase of 4.8%, an increase of 2.2 percentage points over the previous month.
In terms of land transaction value, land turnover in 40 cities in September rose 30.4% month-on-month, and the cumulative year-on-year increase in January-September was 24.8%, down 1.1 percentage points from the previous month. Among them, the monthly turnover of first-tier cities increased 3.8% month-on-month, with a cumulative year-on-year increase of 43.5%; the monthly turnover of second-tier and third-tier cities increased by 38.6% month-on-month, with a cumulative year-on-year increase of 20.2%.
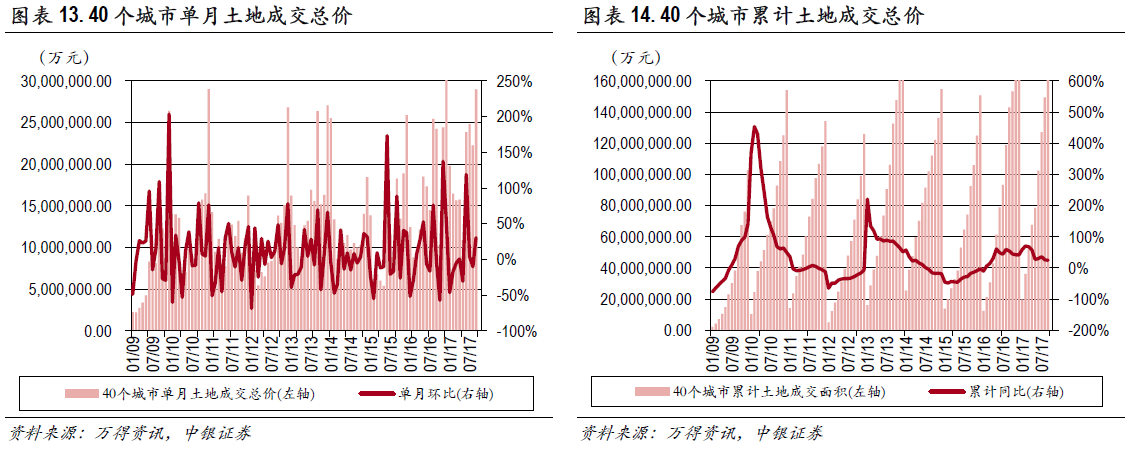
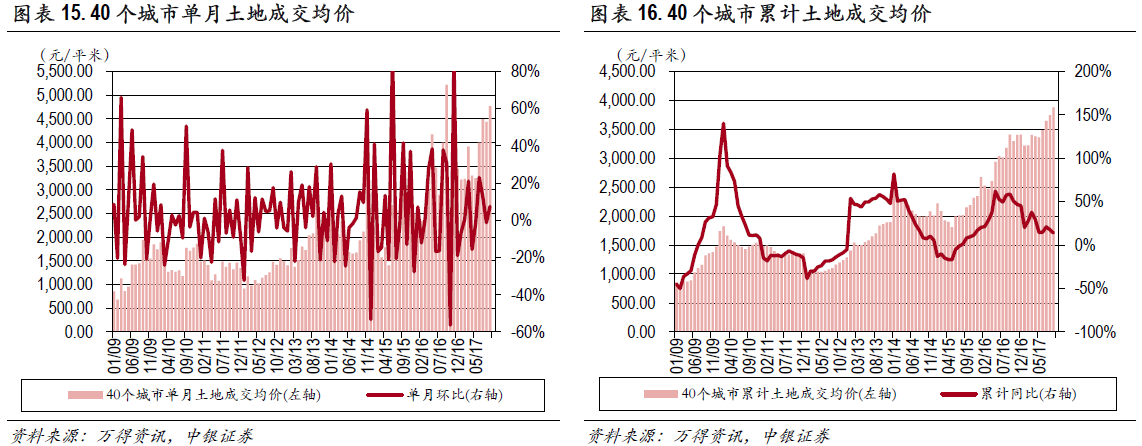
In terms of land transaction prices, the average price of land concessions in 40 cities in September was 4767.76 yuan/square meter, up 7.5% from the previous month. The average cumulative transaction price for January-September was 3882.8 yuan/square meter, up 13.9% year on year, down 3.8 percentage points from the previous month. Among them, the average monthly transaction price of first-tier cities fell 39.7% month-on-month, up 50.8% year-on-year, and a cumulative year-on-year decrease of 21.4%, 2.7 percentage points narrower than the previous month; the average monthly transaction price of second-tier and third-tier cities rose 18.7% month-on-month, down 16.1% year-on-year, and a cumulative year-on-year increase of 14.7%, down 6.8 percentage points from the previous month.
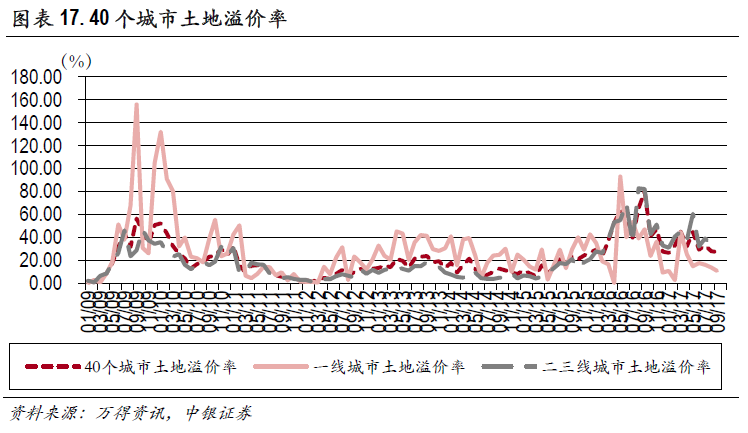
In terms of land premium rates, the land premium rate for 40 cities in September was 26.95%, down 0.89 percentage points from the previous month and 53.02 percentage points from the same period last year. Among them, the land premium rate for first-tier cities was 10.55%, down 3.01 percentage points from the previous year, down 36.56 percentage points from the same period last year; the land premium rate for second-tier and third-tier cities was 31.47%, down 1.55 percentage points from the same period last year, down 50.69 percentage points from the same period last year.
(Editor: Jiang Yu)
