
 Yahoo Finance
 Returns On Capital Signal Tricky Times Ahead For Zheneng Jinjiang Environment Holding (SGX:BWM)
What are the early trends we should look for to identify a stock that could multiply in value over the long term? In a perfect world, we'd like to see a company investing more capital into its business and ideally the returns earned from that capital are also increasing. If you see this, it typically means it's a company with a great business model and plenty of profitable reinvestment opportunities. Although, when we looked at Zheneng Jinjiang Environment Holding (SGX:BWM), it didn't seem to tick all of these boxes.
Understanding Return On Capital Employed (ROCE)
For those that aren't sure what ROCE is, it measures the amount of pre-tax profits a company can generate from the capital employed in its business. To calculate this metric for Zheneng Jinjiang Environment Holding, this is the formula:
Return on Capital Employed = Earnings Before Interest and Tax (EBIT) ÷ (Total Assets - Current Liabilities)
0.062 = CN¥971m ÷ (CN¥22b - CN¥5.7b) (Based on the trailing twelve months to June 2023).
Therefore, Zheneng Jinjiang Environment Holding has an ROCE of 6.2%. In absolute terms, that's a low return but it's around the Renewable Energy industry average of 7.0%.
Check out our latest analysis for Zheneng Jinjiang Environment Holding
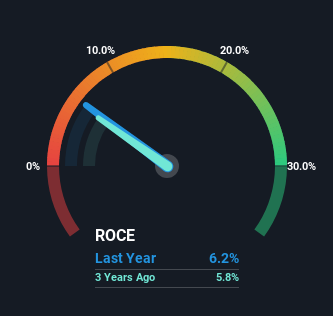
Historical performance is a great place to start when researching a stock so above you can see the gauge for Zheneng Jinjiang Environment Holding's ROCE against it's prior returns. If you'd like to look at how Zheneng Jinjiang Environment Holding has performed in the past in other metrics, you can view this free graph of past earnings, revenue and cash flow.
The Trend Of ROCE
On the surface, the trend of ROCE at Zheneng Jinjiang Environment Holding doesn't inspire confidence. Over the last five years, returns on capital have decreased to 6.2% from 8.2% five years ago. On the other hand, the company has been employing more capital without a corresponding improvement in sales in the last year, which could suggest these investments are longer term plays. It may take some time before the company starts to see any change in earnings from these investments.
The Key Takeaway
In summary, Zheneng Jinjiang Environment Holding is reinvesting funds back into the business for growth but unfortunately it looks like sales haven't increased much just yet. And investors appear hesitant that the trends will pick up because the stock has fallen 49% in the last five years. On the whole, we aren't too inspired by the underlying trends and we think there may be better chances of finding a multi-bagger elsewhere.
One more thing, we've spotted 3 warning signs facing Zheneng Jinjiang Environment Holding that you might find interesting.
If you want to search for solid companies with great earnings, check out this free list of companies with good balance sheets and impressive returns on equity.
Have feedback on this article? Concerned about the content? Get in touch with us directly. Alternatively, email editorial-team (at) simplywallst.com.
This article by Simply Wall St is general in nature. We provide commentary based on historical data and analyst forecasts only using an unbiased methodology and our articles are not intended to be financial advice. It does not constitute a recommendation to buy or sell any stock, and does not take account of your objectives, or your financial situation. We aim to bring you long-term focused analysis driven by fundamental data. Note that our analysis may not factor in the latest price-sensitive company announcements or qualitative material. Simply Wall St has no position in any stocks mentioned.
