Versalink Holdings (Catalist:40N) investors are sitting on a loss of 3.2% if they invested five years ago
Ideally, your overall portfolio should beat the market average. But even the best stock picker will only win with some selections. So we wouldn't blame long term Versalink Holdings Limited (Catalist:40N) shareholders for doubting their decision to hold, with the stock down 65% over a half decade. Unfortunately the share price momentum is still quite negative, with prices down 15% in thirty days.
Since shareholders are down over the longer term, lets look at the underlying fundamentals over the that time and see if they've been consistent with returns.
See our latest analysis for Versalink Holdings
To quote Buffett, 'Ships will sail around the world but the Flat Earth Society will flourish. There will continue to be wide discrepancies between price and value in the marketplace...' One imperfect but simple way to consider how the market perception of a company has shifted is to compare the change in the earnings per share (EPS) with the share price movement.
Versalink Holdings became profitable within the last five years. Most would consider that to be a good thing, so it's counter-intuitive to see the share price declining. Other metrics might give us a better handle on how its value is changing over time.
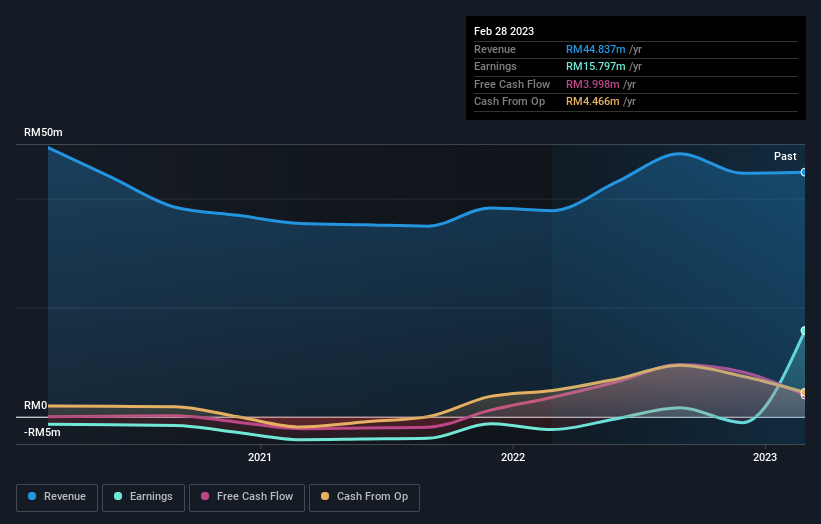
The steady dividend doesn't really explain why the share price is down. It could be that the revenue decline of 8.3% per year is viewed as evidence that Versalink Holdings is shrinking. With dividends up, but revenue down, some investors might be concluding that the company is no longer growing.
You can see how earnings and revenue have changed over time in the image below (click on the chart to see the exact values).
It's probably worth noting we've seen significant insider buying in the last quarter, which we consider a positive. On the other hand, we think the revenue and earnings trends are much more meaningful measures of the business. This free interactive report on Versalink Holdings' earnings, revenue and cash flow is a great place to start, if you want to investigate the stock further.
What About Dividends?
It is important to consider the total shareholder return, as well as the share price return, for any given stock. The TSR incorporates the value of any spin-offs or discounted capital raisings, along with any dividends, based on the assumption that the dividends are reinvested. Arguably, the TSR gives a more comprehensive picture of the return generated by a stock. As it happens, Versalink Holdings' TSR for the last 5 years was -3.2%, which exceeds the share price return mentioned earlier. And there's no prize for guessing that the dividend payments largely explain the divergence!
A Different Perspective
It's nice to see that Versalink Holdings shareholders have received a total shareholder return of 70% over the last year. Of course, that includes the dividend. Notably the five-year annualised TSR loss of 0.6% per year compares very unfavourably with the recent share price performance. We generally put more weight on the long term performance over the short term, but the recent improvement could hint at a (positive) inflection point within the business. It's always interesting to track share price performance over the longer term. But to understand Versalink Holdings better, we need to consider many other factors. For example, we've discovered 5 warning signs for Versalink Holdings (2 are potentially serious!) that you should be aware of before investing here.
Versalink Holdings is not the only stock insiders are buying. So take a peek at this free list of growing companies with insider buying.
Please note, the market returns quoted in this article reflect the market weighted average returns of stocks that currently trade on Singaporean exchanges.
Have feedback on this article? Concerned about the content? Get in touch with us directly. Alternatively, email editorial-team (at) simplywallst.com.
This article by Simply Wall St is general in nature. We provide commentary based on historical data and analyst forecasts only using an unbiased methodology and our articles are not intended to be financial advice. It does not constitute a recommendation to buy or sell any stock, and does not take account of your objectives, or your financial situation. We aim to bring you long-term focused analysis driven by fundamental data. Note that our analysis may not factor in the latest price-sensitive company announcements or qualitative material. Simply Wall St has no position in any stocks mentioned.
