
 Yahoo Finance
 Thakral (SGX:AWI) shareholders have earned a 22% CAGR over the last three years
One simple way to benefit from the stock market is to buy an index fund. But if you pick the right individual stocks, you could make more than that. For example, the Thakral Corporation Ltd (SGX:AWI) share price is up 45% in the last three years, clearly besting the market return of around 10% (not including dividends). However, more recent returns haven't been as impressive as that, with the stock returning just 24% in the last year , including dividends .
With that in mind, it's worth seeing if the company's underlying fundamentals have been the driver of long term performance, or if there are some discrepancies.
View our latest analysis for Thakral
There is no denying that markets are sometimes efficient, but prices do not always reflect underlying business performance. One flawed but reasonable way to assess how sentiment around a company has changed is to compare the earnings per share (EPS) with the share price.
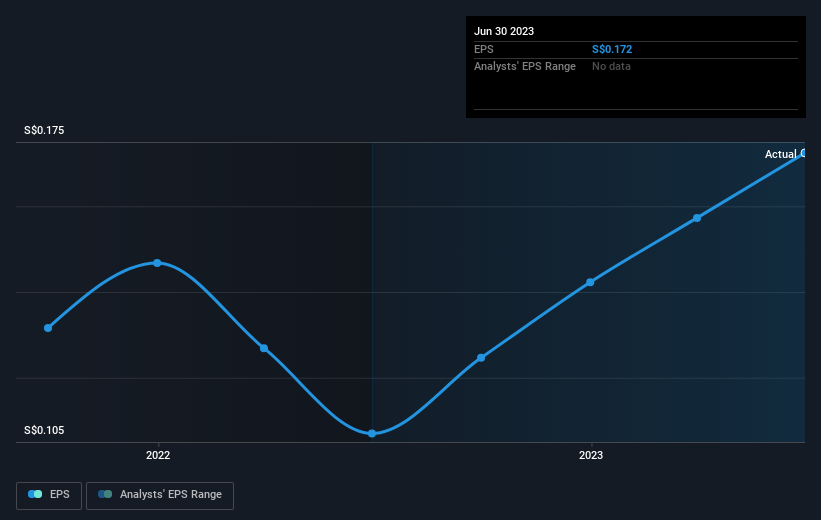
Thakral was able to grow its EPS at 52% per year over three years, sending the share price higher. This EPS growth is higher than the 13% average annual increase in the share price. So one could reasonably conclude that the market has cooled on the stock. We'd venture the lowish P/E ratio of 3.50 also reflects the negative sentiment around the stock.
You can see how EPS has changed over time in the image below (click on the chart to see the exact values).
Dive deeper into Thakral's key metrics by checking this interactive graph of Thakral's earnings, revenue and cash flow.
What About Dividends?
As well as measuring the share price return, investors should also consider the total shareholder return (TSR). The TSR is a return calculation that accounts for the value of cash dividends (assuming that any dividend received was reinvested) and the calculated value of any discounted capital raisings and spin-offs. So for companies that pay a generous dividend, the TSR is often a lot higher than the share price return. We note that for Thakral the TSR over the last 3 years was 81%, which is better than the share price return mentioned above. And there's no prize for guessing that the dividend payments largely explain the divergence!
A Different Perspective
We're pleased to report that Thakral shareholders have received a total shareholder return of 24% over one year. That's including the dividend. That gain is better than the annual TSR over five years, which is 15%. Therefore it seems like sentiment around the company has been positive lately. Someone with an optimistic perspective could view the recent improvement in TSR as indicating that the business itself is getting better with time. I find it very interesting to look at share price over the long term as a proxy for business performance. But to truly gain insight, we need to consider other information, too. For instance, we've identified 3 warning signs for Thakral that you should be aware of.
But note: Thakral may not be the best stock to buy. So take a peek at this free list of interesting companies with past earnings growth (and further growth forecast).
Please note, the market returns quoted in this article reflect the market weighted average returns of stocks that currently trade on Singaporean exchanges.
Have feedback on this article? Concerned about the content? Get in touch with us directly. Alternatively, email editorial-team (at) simplywallst.com.
This article by Simply Wall St is general in nature. We provide commentary based on historical data and analyst forecasts only using an unbiased methodology and our articles are not intended to be financial advice. It does not constitute a recommendation to buy or sell any stock, and does not take account of your objectives, or your financial situation. We aim to bring you long-term focused analysis driven by fundamental data. Note that our analysis may not factor in the latest price-sensitive company announcements or qualitative material. Simply Wall St has no position in any stocks mentioned.
