
Due to the reason of shorting data sources, the charts of short selling of Hong Kong stocks and US stocks are slightly different, which are described below:
I. Hong Kong stocks-short selling ratio chart
Proportion of short selling transactions = number of short selling shares / total number of shares sold
The high proportion of short selling, on the one hand, reflects that investors are bearish on the future stock price, on the other hand, because the short sellers need to buy stocks to close their positions in the later stage, it will also stimulate the stock price to rise in the future.
Here is a case to explain the above point of view:
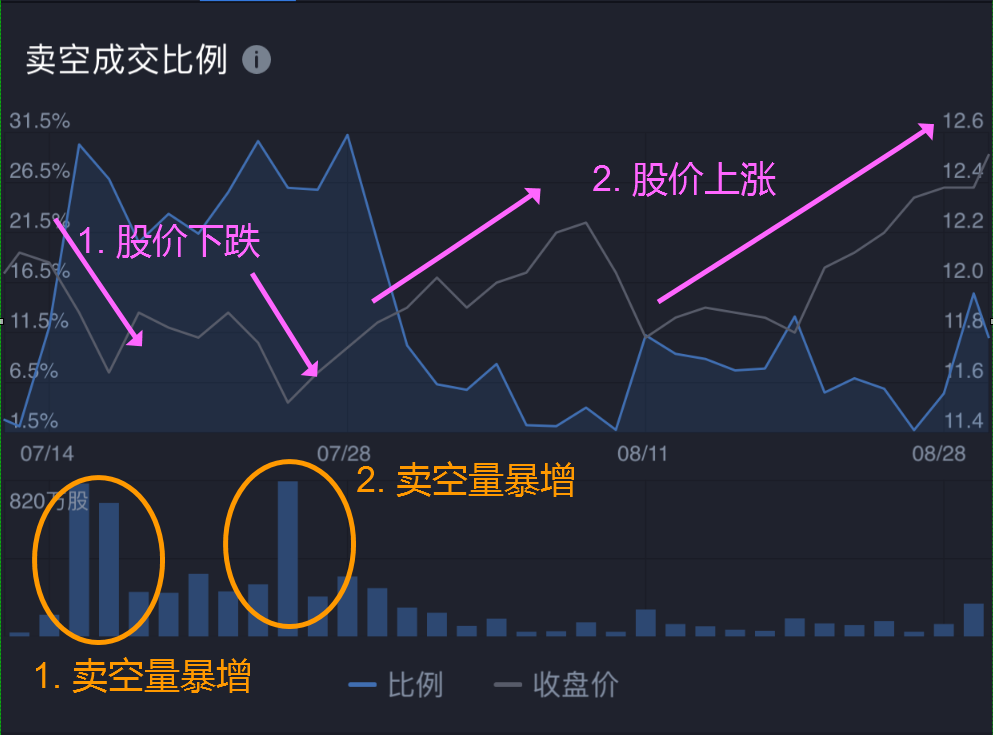
There were two sharp increases in short selling volume in mid-July and late July, respectively, and the proportion of short selling transactions was very high, corresponding to a decline in stock prices on the same day. The fall in share prices is likely to be affected in part by a surge in the number of short sellers.
The number of short sellers decreased significantly after the end of July, and share prices rose. On the one hand, it may be due to high investor bullish sentiment and strong demand to buy stocks, which may lead to a rise in share prices; on the other hand, it may be because investors who have sold short in mid-and late July need to buy stocks to close their positions, which has led to an increase in demand for stocks in the market.
Interpretation of the field of "Total need to declare short position"
Under the Securities and Futures (short position reporting) rules (the short position reporting rules) which came into effect on 18 June 2012, anyone who has a reportable short position is required to notify the SFC.
(to put it simply, if the short selling quantity reaches the declaration level specified by the SFC, you need to declare the number of short positions you have.)
Declaration requirements and announcement time
Net short position to be reported
The trigger threshold of the declaration is that the total short position at the end of the last trading day of each week reaches or exceeds 0.02% or 30 million yuan of the issued share capital of the listed company concerned, whichever is the less.
The scope of declaration is limited to shares of companies constituting the Hang Seng Index or Hang Seng China Enterprises Index or other financial companies specified by the SFC ("specified shares")
The reporting requirement applies only to short positions arising from trading in specified shares on the Stock Exchange of Hong Kong (SEHK) or through any recognized automated trading service.
In general, the reporting day is the last trading day of each week, and reportable short positions must be reported within two business days after the reporting day. The above report will be submitted once a week.
Three business days after receipt of the relevant report, the SFC will publish the total short position of each stock on its official website anonymously, that is, "the aggregate of specified shares is required to report short position".
Note: according to the short position reporting rules, the data of the previous week are generally released every Friday, and the announcement date will be adjusted accordingly if the market is closed.
Reference link
SFC official website:
Https://sc.sfc.hk/gb/www.sfc.hk/web/TC/index.html
Short position declaration list of shares specified by ──:
Https://www.sfc.hk/web/TC/regulatory-functions/market-infrastructure-and-trading/short-position-reporting/list-of-specified-shares-ntc.html
Declaration of short position the total number of shares specified by ── shall declare short position:
Https://www.sfc.hk/web/TC/regulatory-functions/market-infrastructure-and-trading/short-position-reporting/aggregated-short-positions-of-specified-shares.html
Short position reporting ── "frequently asked questions":
Https://www.sfc.hk/web/TC/files/SOM/SPR/FAQ/FAQs_on_SPR_TC_7%20Nov%202017.pdf
II. Us stocks-short selling ratio chart
Short selling ratio of US stocks = number of outstanding shares / number of outstanding shares
Please note that the above "open shares", not "short selling shares", and the time granularity of this chart is updated every two weeks.
The basic interpretation of the chart is basically consistent with the chart of short selling of Hong Kong stocks:
The large number of open positions means that the current bears are depressing the stock price.
A sharp decrease in the number of open shares means that bears are buying stocks to close their positions, which will further stimulate the stock price to rise.
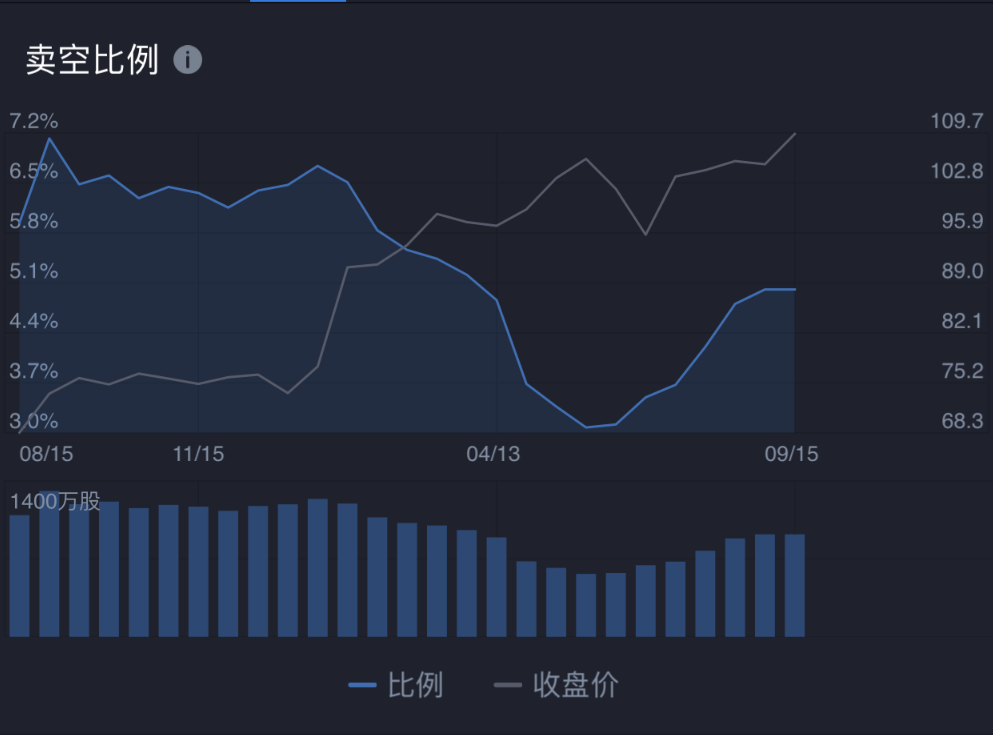
The above actual cases basically confirm the above point of view, in most of the time before the chart, the stock price trend is completely negatively correlated with the number of open shares, the stock price is low if the short selling ratio is high, and the stock price is high if the short selling ratio is low. It is worth noting that in the last stage of the chart, the proportion of short selling is high, but the stock price is also higher, which also shows that there are many factors that affect the stock price, and we cannot judge the stock price trend only by a certain index.
For the record, this point of view does not constitute any investment advice. There are many factors that affect the stock price, so we must not make a buying and selling decision based on an one-sided chart analysis.