
NVIDIA Corporation (NASDAQ:NVDA) was popping up about 2% at one point Friday, in tandem with the general market, after core Personal Consumption Expenditure data cooled to its lowest reading since September 2021.
Unlike several other big-tech stocks, Nvidia hasn't found itself under regulatory scrutiny until Thursday, when it was reported that French officials raided several of the company's offices as part of a probe into potential anticompetitive practices.
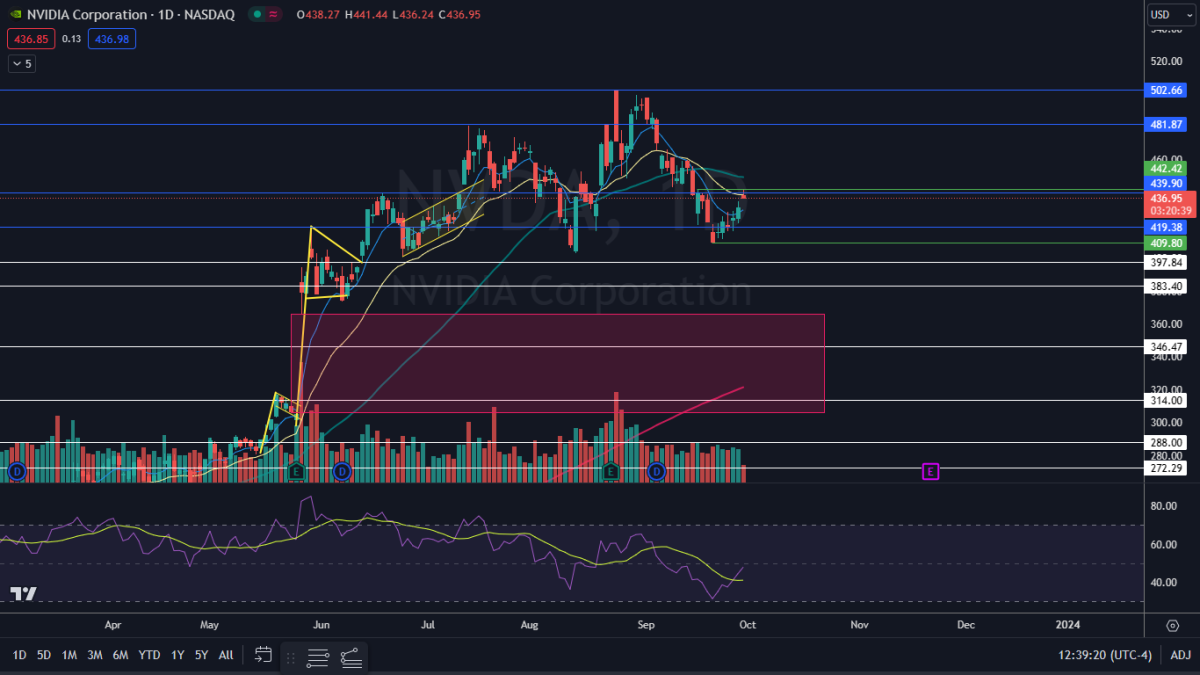
While the news didn't appear to immediately negatively impact shares of Nvidia, technical indicators on the stock's chart show the local top may be in and a retracement could be on the horizon.
Nvidia is trading in a confirmed downtrend and on Friday, the stock looked to be printing a bearish top pattern.
Bearish On Nvidia? Short-term traders looking to hedge a long position, play the dips within a potential continued uptrend or those who believe Nvidia will suffer a bearish reaction to its earnings print, can play retracements using the AXS 1.25x NVDA Bear Daily ETF (NASDAQ:NVDS).
NVDS is a leveraged ETF aiming to track 125% of the opposite daily performance of NVDA. This leverage boosts trade performance, potentially turning small, brief dips in Nvidia's stock into significant gains for traders. Using this ETF eliminates the need to borrow NVDA stock from your broker to sell short, offering retail traders an easy and convenient way to play Nvidia bearishly.
Want direct analysis? Find me in the BZ Pro lounge! Click here for a free trial.
The Nvidia Chart: When Nvidia rose to its high-of-day, the stock rejected the $442.42 mark and formed a double top pattern, when paired with similar price action on Sept. 18. The rise to that level and the subsequent drop also caused the stock to form a shooting star candlestick, which suggests the local top may have occurred and Nvidia will fall lower on Monday.
- Because Nvidia couldn't break through the $442 area, the stock was unable to form a higher high, which suggests the downtrend may remain intact. If Nvidia falls lower next week but rebounds before breaking below $409.80, a higher low will form, however, which will negate the downtrend.
- If Nvidia's downtrend continues, the stock will eventually fall into a gap that exists between $306.07 and $366.35. If that happens, the stock is likely to find support at the bottom range of that area.
- Bullish traders want to see big bullish volume come in and drive Nvidia up above $442, which would negate the double top pattern.
- Nvidia has resistance above at $439.90 and at $481.87 and support below at $419.38 and at $397.84.
 Read Next: Pinterest, Cloudflare And 2 Other Stocks Insiders Are Selling