
 Yahoo Finance
 Investor Optimism Abounds Donaco International Limited (ASX:DNA) But Growth Is Lacking
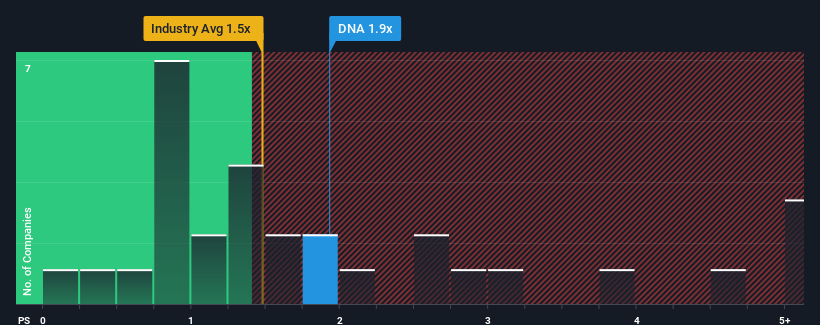
With a median price-to-sales (or "P/S") ratio of close to 1.5x in the Hospitality industry in Australia, you could be forgiven for feeling indifferent about Donaco International Limited's (ASX:DNA) P/S ratio of 1.9x. However, investors might be overlooking a clear opportunity or potential setback if there is no rational basis for the P/S.
View our latest analysis for Donaco International
What Does Donaco International's Recent Performance Look Like?
Donaco International certainly has been doing a great job lately as it's been growing its revenue at a really rapid pace. It might be that many expect the strong revenue performance to wane, which has kept the share price, and thus the P/S ratio, from rising. If you like the company, you'd be hoping this isn't the case so that you could potentially pick up some stock while it's not quite in favour.
Want the full picture on earnings, revenue and cash flow for the company? Then our free report on Donaco International will help you shine a light on its historical performance.
What Are Revenue Growth Metrics Telling Us About The P/S?
There's an inherent assumption that a company should be matching the industry for P/S ratios like Donaco International's to be considered reasonable.
Retrospectively, the last year delivered an explosive gain to the company's top line. However, this wasn't enough as the latest three year period has seen the company endure a nasty 55% drop in revenue in aggregate. So unfortunately, we have to acknowledge that the company has not done a great job of growing revenues over that time.
In contrast to the company, the rest of the industry is expected to grow by 15% over the next year, which really puts the company's recent medium-term revenue decline into perspective.
With this in mind, we find it worrying that Donaco International's P/S exceeds that of its industry peers. It seems most investors are ignoring the recent poor growth rate and are hoping for a turnaround in the company's business prospects. There's a good chance existing shareholders are setting themselves up for future disappointment if the P/S falls to levels more in line with the recent negative growth rates.
The Bottom Line On Donaco International's P/S
Generally, our preference is to limit the use of the price-to-sales ratio to establishing what the market thinks about the overall health of a company.
We find it unexpected that Donaco International trades at a P/S ratio that is comparable to the rest of the industry, despite experiencing declining revenues during the medium-term, while the industry as a whole is expected to grow. When we see revenue heading backwards in the context of growing industry forecasts, it'd make sense to expect a possible share price decline on the horizon, sending the moderate P/S lower. Unless the recent medium-term conditions improve markedly, investors will have a hard time accepting the share price as fair value.
You should always think about risks. Case in point, we've spotted 2 warning signs for Donaco International you should be aware of.
If companies with solid past earnings growth is up your alley, you may wish to see this free collection of other companies with strong earnings growth and low P/E ratios.
Have feedback on this article? Concerned about the content? Get in touch with us directly. Alternatively, email editorial-team (at) simplywallst.com.
This article by Simply Wall St is general in nature. We provide commentary based on historical data and analyst forecasts only using an unbiased methodology and our articles are not intended to be financial advice. It does not constitute a recommendation to buy or sell any stock, and does not take account of your objectives, or your financial situation. We aim to bring you long-term focused analysis driven by fundamental data. Note that our analysis may not factor in the latest price-sensitive company announcements or qualitative material. Simply Wall St has no position in any stocks mentioned.
