
Authors: Wang Hanfeng, Lin Yingqi
Interpretation of the position information reported by the mainland-Hong Kong Stock Connect Fund in the second quarter
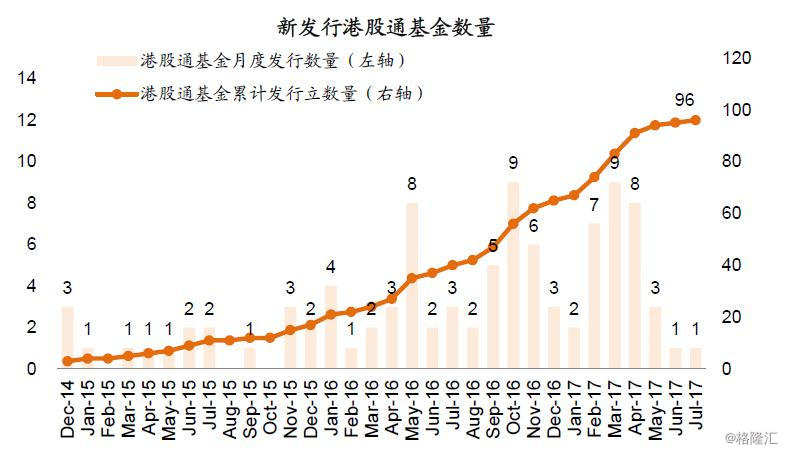
Since March 2015, when regulators allowed mainland public offering funds to invest in Hong Kong stocks through the interconnection mechanism, the number of qualified "Hong Kong Stock Connect" funds has reached 96, with a net worth of 79.1 billion yuan. According to the second quarterly report disclosed by the Fund, we have found the following characteristics of the positions of these Hong Kong Stock Connect funds:
1) the stock position has continued to rise in recent years:The stock position of the Hong Kong Stock Exchange Fund (including A shares and Hong Kong stocks) rose from 33 per cent in the first quarter of 2015 to 78 per cent in the first quarter of 2017 and fell slightly to 76 per cent in the second quarter. Correspondingly, cash positions continued to decline from 50% in the first quarter of 2015 to 11% in the second quarter of 2017.
2) the position ratio of Hong Kong stocks to A shares is about 6:4:The share of the top 10 heavy stocks disclosed by the Hong Kong Stock Exchange Fund rose from only 24 per cent in the first quarter of 2015 to 59 per cent in the second quarter of 2017. According to the 6:4 ratio of heavy Hong Kong stocks / A shares, it is estimated that the total Hong Kong stock position of the Hong Kong Stock Connect Fund is about 50% of the net value, with a total size of about 40 billion yuan. In June 2017, the CSRC issued new rules to improve the supervision of the Hong Kong Stock Connect Fund, stipulating that funds whose names contain the words "Hong Kong stocks" must invest 80% of their non-cash assets in Hong Kong stocks. It is expected that the proportion of Hong Kong stocks allocated to the Hong Kong Stock Connect Fund will continue to increase under the influence of the new rules.
3) Hong Kong stocks are heavily positioned in financial and Internet sectors:Among the top 10 heavy stocks disclosed by the Hong Kong Stock Exchange Fund, the sectors with the highest share of Hong Kong stock market value include finance (39 per cent), information technology (21 per cent) and optional consumption (15 per cent), accounting for about 75 per cent, with a low allocation for cyclical sectors. The 10 Hong Kong stocks with the largest market capitalization are Tencent, Geely Automobile, China Construction Bank Corporation, HSBC Holdings PLC, Guangzhou Automobile Group, Industrial and Commercial Bank of China, China Mobile Limited, Ping An Insurance, China Taiping and PICC Property and Casualty (figure 13).
4) among Hong Kong stocks, positions in insurance and medical sectors rose the most in the second quarter, while positions in telecommunications and energy sectors declined the most:The five Hong Kong stocks with the largest increase in positions are PICC Property and Casualty, New China Life Insurance, China Taiping, Ping An Insurance and traditional Chinese medicine, while the five Hong Kong stocks with the largest decline are China Unicom, China Construction Bank Corporation, China Mobile Limited, China Petroleum & Chemical Corp and China soft International (Chart 14-15).
5) A-share heavy consumption, technology hardware:The 10 A shares with the highest proportion of heavy position market capitalization in the second quarter are Yili shares, Midea, Haikangwei, Ping An Insurance, Gree Electric Appliances, Shanghai Fosun Pharmaceutical, Lixun Precision, Fuyao Glass Industry Group, Wuliangye and Sanhuan Group (figure 13).
6) A-share heavy positions increased most in finance and public utilities in the second quarter, while medical and optional consumption positions decreased the most in the second quarter.The five A-shares with the largest increase in positions are Ping An Insurance, Gree Electric Appliances, Wuliangye, Chuantou Energy and Sanhuan Group, while the five stocks with the largest decline in positions are SAIC, Haikangwei, Longji, Shanghai Fosun Pharmaceutical and Hualu Hengsheng (Chart 14-15).
Although southbound capital inflows were temporarily suspended in June due to the warming of A shares, southbound funds have returned to strength since July, with an average daily inflow of HK $1.9 billion, exceeding the daily average of HK $700 million in June and HK $1.4 billion so far this year, reflecting that the southward allocation momentum of mainland institutions is still strong. We maintain last year's forecast of southward capital of 2000-400 billion yuan per year and 10-2 billion yuan per day for the whole year. Considering that China's growth is expected to continue to exceed expectations, the tightening of external currencies is less than expected, the US dollar is weak, the southward allocation of mainland funds is still strong, and overseas funds are still cautious and underallocated towards China as a whole, we remain optimistic about Hong Kong stocks. The Hang Seng China Enterprises Index is expected to reach 12000 this year. Recently, the economy has exceeded expectations, finance should be the focus, cyclical sector expectations also exist, performance will also be performed.
Chart 1: a total of 96 Hong Kong Stock Connect funds have been issued in the mainland (merging ABC funds), which accelerated in the first quarter of this year.
China International Capital Corporation Research Department
Figure 2: … The size of the issued Hong Kong Stock Connect Fund has reached 79.1 billion yuan.
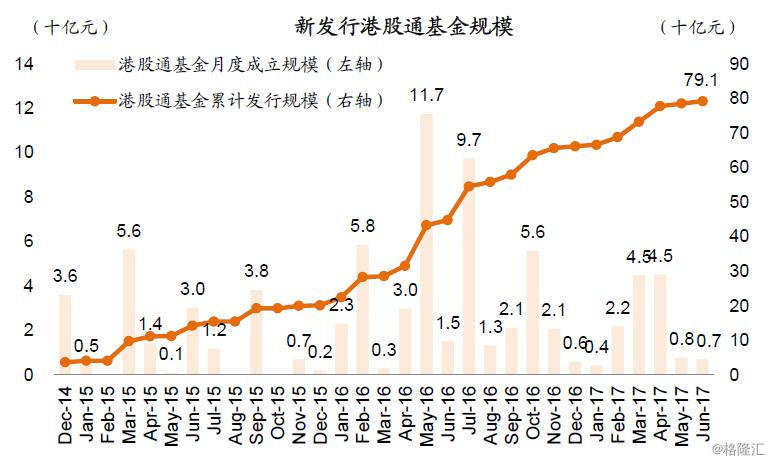
Chart 3: the market value of the Hong Kong Stock Connect Fund reported in the second quarter is about $55.4 billion.

Figure 4: … Stock positions (including A shares and Hong Kong stocks) increased from 33% in the first quarter of 2015 to 76% in the second quarter of 2017.

China International Capital Corporation Research Department
Chart 5: in terms of industry allocation of heavy stocks (including A shares and Hong Kong stocks), the financial sector accounted for the highest proportion of positions in the second quarter of 2017 (27%), followed by information technology and optional consumption.

Figure 6: … The share of heavy stocks in Hong Kong and China rose from 24% in the first quarter of 2015 to 59% in the second quarter of 2017.

Chart 7: Hong Kong Stock Connect Fund in the second quarter heavy positions of A shares are mainly concentrated in daily consumption (23%), information technology (23%) and optional consumption (22%), the proportion of financial and cyclical sectors is relatively low.

Chart 8: in the second quarter of 2017, positions in heavy A-share finance and public utilities sectors increased the most, while positions in medical and optional consumer sectors declined the most.

Chart 9: Hong Kong Stock Connect Fund in the second quarter, heavy positions in Hong Kong stocks are mainly concentrated in the financial (39%), information technology (21%) and optional consumer (15%) sectors.

Figure 10: … In the second quarter of 2017, positions in the financial and medical sectors of Hong Kong stocks rose the most, while those in telecommunications and energy sectors decreased the most.

Chart 11: sorting out the important policies of the Shanghai-Shenzhen-Hong Kong Stock Connect: further regulations on Hong Kong stock positions and managers of the Hong Kong Stock Connect Fund were made in June 2017

Source: Shanghai Stock Exchange, Securities Times, Financial Times, China International Capital Corporation Research Department
Chart 12: a total of 96 mainland funds have been issued allowing investment in Hong Kong stocks through the interconnection mechanism (merging ABC funds)

Chart 13: the stocks with the largest market capitalization of the Hong Kong Stock Exchange Fund in the second quarter (among which Hong Kong stocks are marked in blue)

Chart 14: the stocks with the largest increase in the market value of heavy positions in the Hong Kong Stock Exchange Fund in the second quarter (among which Hong Kong stocks are marked in blue)

Chart 15: stocks with the largest decline in the market value of heavy positions in the Hong Kong Stock Exchange Fund in the second quarter (among which Hong Kong stocks are marked in blue)

Chart 16: the stocks with the largest number of heavy fund holders in the Hong Kong Stock Exchange Fund in the second quarter (among which Hong Kong stocks are marked in blue)

Chart 17: the stocks with the largest increase in the number of heavy fund holders of the Hong Kong Stock Connect Fund in the second quarter (among which Hong Kong stocks are marked in blue)

Chart 18: the stocks with the largest decline in the number of heavy fund holders of the Hong Kong Stock Connect Fund in the second quarter (among which Hong Kong stocks are marked in blue)
