
This article comes from the official account of Wechat, "CITIC Construction Investment non-Bank Financial Research". The authors are Zhao ran and Wang Xin, analysts of CITIC Construction Investment.
Abstract
The Analysis of profit Source under the current report system
Under the current report, the business income of insurance companies mainly comes from premium income and investment income, which reflects the ability of the company to obtain insurance policies. After the completion of the transformation of large-scale insurance, the main driving factors of insurance premiums are agent scale and per capita production capacity. Under the current trend of indemnificatory product transformation, per capita production capacity is more important than manpower scale. According to the analysis of the income statement, the underwriting profitability of insurance companies is gradually improving, and the business quality is safe > Pacific Insurance > Xinhua > Guoshou; the elasticity of investment profitability depends on the performance of equity assets, and the asset allocation of Ping an and Xinhua equity assets is relatively high. the bull market can earn more profits. However, under the current statement system, the unexpired liability reserve is a black box, which contains the residual margin, but the release of the policy profit can not be obtained directly from the income statement system, which is not convenient for comparison and analysis. Take Ping an as an example, the remaining marginal amortization increased by more than 20%, driving the growth of pre-tax operating profit by more than 20%.
The changes brought about by IFRS17
Under the IFRS17 criterion, the recognition criteria of premium income and reserve liabilities change, and the operating income bubble is squeezed out, which leads to a sharp decline in insurance business income. The black box of the reserve item becomes transparent and is broken down into "expected compensation, expected cost, risk adjustment and insurance contract service margin". Corresponding to the premium income, the liability part is also separated from the investment part, and the total scale will be reduced. in addition, the change in the discount rate will increase the volatility of negative debt projects. After the implementation of IFRS17, the structure of the income statement will change greatly. The profit source is mainly divided into "insurance service income" and "investment business income". The difference between the unexpired liability reserve will be clearly listed in the part of the profit generated by the insurance service, which will clearly reflect the profit source structure and enhance the readability of the report.
From Accounting statement to embedded value Analysis
The most important connection between the two lies in the new business, so the new single premium and the new business value are important observation indicators. The drivers of embedded value include new business value, two stable contribution factors of expected return of embedded value, and interference items such as assumption change, operation deviation, investment deviation and so on. The expected return is the safety pad for positive EV growth, and its contribution rate is usually close to but less than the discount rate assumption. NBV is an indicator of EV growth. According to sustainable growth, EV growth will eventually converge to the expected rate of return or NBV growth (which is greater). Interference items affect the volatility and credibility of EV, the average difference of investment return is positive contribution, the difference of operation experience is better, the contribution degree of interference item to intrinsic value is Ping an > Xinhua > Taibao > Guoshou.
Valuation and investment advice
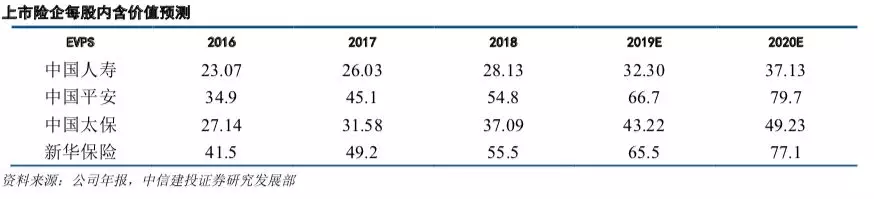
According to the model, we predict that the embedded value per share of the four companies in 2019 is Ping An Insurance 66.7,New China Life Insurance 65.5, China Pacific Insurance 43.2 and China Life Insurance Company Limited 32.3 yuan, respectively, and the assessed value per share is 104,72,103 and 49 yuan respectively. The P/AV multiples corresponding to the current stock price are 0.8,0.5,0.51,0.55 respectively. The room for growth based on the current stock price is 25%, 99%, 98% and 82%, respectively.
Be optimistic about the investment value of insurance stocks and maintain the "buy" rating: 1. The insurance industry is still in the stage of rapid development, with demand and supply supporting the growth of premium income and increasing agent production capacity; 2. In the transformation of product structure, safeguard products develop rapidly, product value increases, and underwriting profitability continues to improve. 3. The investment side benefits from the improvement of the equity market, and the rate of return on investment is significantly higher than that of last year, and the regulatory policy intends to further relax the equity investment. 4, the expected return of embedded value is released steadily year by year, superimposing the contribution of new business value. The embedded value of insurance companies is growing steadily at a rate of 15% and 20% per year. 5. the valuation is at an all-time low, and there is more room for the stock price to rise.
Catalogue
Chart catalogue


-- the following is the body--
I. the analysis of the source of profit under the current report system
International Financial reporting Standards No. 4: insurance contracts (hereinafter referred to as IFRS 4) issued in 2004 allows enterprises to use a variety of different accounting methods to measure insurance contracts to reflect the accounting requirements of different countries, which leads to substantial differences in the accounting treatment of insurance contracts in different countries. The relevant standards of insurance accounting implemented by China's insurance industry mainly include the following four. In 2006, the Ministry of Finance issued two major accounting standards: "Accounting Standards for Enterprises No. 25-original Insurance contracts" (hereinafter referred to as CAS25), "Accounting Standards for Enterprises No. 26-reinsurance contracts" (hereinafter referred to as CAS26), and "interpretation of Accounting Standards for Enterprises No. 2" issued in 2008. The regulations on Accounting treatment of Insurance contracts promulgated by the Insurance Regulatory Commission in 2009 also fails to fully consider and reflect the long-term nature and complexity of insurance products. On May 18, 2017, the International Accounting Standards Board officially issued IFRS17, which will come into effect on January 1, 2021, which will unify the accounting treatment of insurance contracts in various countries and enhance the horizontal comparability of insurance accounting statements around the world. The adjustment of IFRS17 in recognition, measurement and information disclosure will make the traditional financial reporting face major changes. We first sort out the relationship between traditional financial reporting and value, and then explore the changes brought about by the new standards.

1.1 main income items-premiums
From the income statement, we are most concerned about the underwriting profit and net profit of insurance companies, which is one of the key indicators to reflect the performance and performance of insurance companies. From a disassembly point of view, underwriting profit = underwriting income-underwriting expenses, underwriting income we mainly focus on premium income and earned premiums, underwriting expenses mainly include compensation expenses and handling fees and commission expenses, management expenses and so on.
1.1.1 Premium income and earned premiums
Insurance companies usually refer to the sum of the original premium income, the new payment of the protected investment money and the new payment of the investment-linked insurance separate account as the scale premium, but the premium income we usually refer to refers to the original insurance premium income, which includes only the premium part that bears the insurance risk, but also the confirmation of the insurance contract with both protection function and investment function. The regulation of Finance and Accounting [2009] 15 gives insurance companies a certain degree of autonomy. Therefore, the common practice of insurance companies is to split the universal insurance and investment-linked insurance that are easy to split, while the general life insurance and dividend insurance as a whole are tested for major insurance risks, and then confirmed as the original premium income. After the implementation of IFRS17, there will be changes in insurance service confirmation standards, which we will discuss later.
Earned premiums reflect policy acquisition ability. The earned premium corresponds to the actual premium income of the current period, taking into account the factors of inward and outgoing premiums and accrual basis. In terms of the formula, the earned premium = premium income + inward premium-divided premium-withdrawing unexpired liability reserve, the unexpired liability reserve here only takes into account the unexpired liability reserve of short-term insurance, does not include life insurance liability reserve and long-term health insurance liability reserve, so there is a deviation from the accrual basis, which also leads to a "bubble" in the business income of life insurance companies. It can be said that the longer the insurance period, the greater the "foam" of the premium earned. However, premium income or earned premiums represent the ability of insurance companies to obtain insurance policies, which can still be used to measure the growth of insurance companies. In terms of the growth rate of premium income (earned premiums), the CAGR of China Life Insurance Company Limited, Ping An Insurance, China Pacific Insurance and New China Life Insurance in the past five years are 10%, 25%, 16% and 3% respectively, so the growth reflected by the data in the past five years is: Ping An Insurance > China Pacific Insurance > China Life Insurance Company Limited > New China Life Insurance. However, in view of the fact that the rapid development of dividend insurance and universal insurance in 2015-2017 has pushed up the growth rate of premiums, the regulatory restrictions on medium-and short-term products since 2018 have had a certain impact on premiums, and we have extended the period to 10 years. Then get rid of dividend insurance and universal insurance, let's look at the premium growth of various companies. First of all, the 10-year CAGR order of total premium income is Ping An Insurance (23%) > China Pacific Insurance (16%) > New China Life Insurance (10%) > China Life Insurance Company Limited (7%), while the 10-year compound growth rate of premium income excluding dividend insurance and universal insurance is New China Life Insurance (34%) > Ping An Insurance (26%) > China Pacific Insurance (17%). New China Life Insurance was in a period of transition from 2015 to 2017, focusing on indemnificatory insurance, which led to a slowdown in premium growth, but in the long run, he was able to comply with the trend in the tide of insurance products returning to security.

Agent size and per capita production capacity are the main drivers of premium growth. In terms of agent scale, China Life Insurance Company Limited has an absolute advantage. By the first quarter of 1919, the number of agents in each insurance channel reached 1.537 million, and the average monthly effective manpower increased by 37.9% compared with the same period last year. Ping an followed closely to 1.311 million, down 7.5% from the same period last year. Taibao and Xinhua had 84.2 and 370000 agents by the end of 2018, respectively. Affected by the transformation of the product structure in 2018, the difficulty in selling indemnificatory products has led to a slowdown in the growth of agents, while announcing a change in the model of premium growth driven by manpower scale. It is expected that there will still be no large-scale growth of agents in 2019, and the goal of insurance companies will gradually shift to increasing agent production capacity. We use "new office premiums of individual insurance channels / annual average number of agents" to calculate the annual per capita new office premiums to measure the business ability of agents of each company, taking the average of nearly 5 years, agent production capacity Ping An Insurance > New China Life Insurance > China Pacific Insurance > China Life Insurance Company Limited. Under the current situation of the industry, the clearing of agents is a necessary path. New China Life Insurance was the first to clear up in the early stage of transformation, and the team of agents was in a relatively healthy state, which is also an important reason why their per capita production is at a higher level. Ping an and Taibao have also entered the clearing cycle after experiencing rapid growth from 2015 to 2017. With the continuous focus of safeguard products and the gradual upgrading of sales strategy, companies that invest heavily in agent quality construction have more strength to accumulate and grow thin in the later stage, and companies that still rush to scale will have adjustment pressure in the later stage.

1.2 profitability-split based on income statement
According to the current profit statement logic of life insurance companies, pre-tax profit of life insurance companies = earned premiums + investment income-(surrender premium + indemnity + policy dividend + tax and addition + insurance business commission + insurance business and management fees + withdrawal of insurance liability reserve). According to IFRS17's idea, the profit source of insurance company can be divided into two parts: insurance service profit and net investment income according to insurance business and investment business. The disclosure of profit sources in the current statement system is not sufficient. We can only start with the disclosure of data on various subjects in the current income statement, according to the two parts of underwriting business and investment business.
To split the calculation and compare the underwriting profitability and investment profitability of insurance companies.
1.2.1 underwriting profits are basically negative but improve year by year
According to the current reporting system, we use underwriting profit = underwriting income-underwriting expenditure = earned premium-risk cost-operating cost to calculate underwriting profit. The underwriting profitability of insurance companies is measured by [(earned premium-risk cost) / earned premium] and [(earned premium-risk cost-operating cost) / earned premium].
The risk cost includes surrender fund, indemnity expense, insurance liability reserve and policy dividend expense. Since most of the life insurance has the quality of savings, customers can surrender and receive the cash value of the insurance policy at any time, so the surrender payment is an important cash expenditure of the life insurance company. the indemnity expenditure includes compensation expenditure, death and injury medical payment, expiration payment, survival benefit, annuity payment, reinsurance payment and so on. The insurance liability reserve is the current change of the outstanding indemnity reserve, the life insurance liability reserve and the long-term health insurance liability reserve; the policy dividend refers to the part of the surplus of the dividend business allocated to the customer. Operating costs include taxes and surcharges, fees and commissions, business and management fees, and reinsurance fees. However, it should be noted that the cost calculated here also includes the cost generated by the investment business, which is small in scale and has not been split, so the absolute value of our calculated data is not necessarily accurate. however, the trend changes and the comparison of the same industry still have analytical value. After processing the financial data of four companies, it can be found that:
1. The underwriting profit of life insurance business is basically negative, and only relying on premium income can not cover the cost of expenditure in the current year, and the profit still mainly comes from the income of investment assets. However, the trend we can see is that underwriting profit margins are improving year by year, Ping an achieved positive underwriting profits in 2018, and Pacific Insurance's underwriting profit rate has shrunk from negative 2 digits to negative single digits. According to the average data in the past five years, underwriting profitability Ping An Insurance (- 9%) > China Pacific Insurance (- 11.5%) > China Life Insurance Company Limited (- 18.8%) > New China Life Insurance (- 21.7%).
2. If operating costs are not taken into account, only risk costs are taken into account. The ratio of earned premiums to earned premiums reflects the quality of the business to a certain extent, and this ratio decreased significantly or even negative from 2013 to 2015. This is mainly due to the expiration and surrender of high-current-price products in the silver mail channel. The 3-5-year universal insurance sold in 2015-2016 will also expire in the past two years, but the premium scale has increased rapidly in recent years, the pressure of surrender cash flow is not great, and a smooth transition can be achieved. In terms of business quality, Ping An Insurance (21.3%) > China Pacific Insurance (12%) > New China Life Insurance 1.3%) > China Life Insurance Company Limited (0.2%), Ping an and Pacific Insurance are still in the lead, and Xinhua is in exchange with Guoshou. Xinhua mainly accounts for a higher proportion of business and management expenses than Guoshou, and spends more on office building use expenses, while Guoshou has an advantage in its own real estate. And some office buildings with longer service life do not need to be depreciated, so they can control and reduce the cost.

1.2.2 Investment profitability
Investment assets of listed insurance companies account for about 90% of total assets, while Xinhua assets account for about 96% of total assets. Investment assets increase every year with the increase of premiums earned. The five-year CAGR of investment assets of listed companies is Ping An Insurance (17.8%) > China Pacific Insurance (13.1%) > China Life Insurance Company Limited (10.9%) > New China Life Insurance (5%), which is consistent with the compound growth rate of earned premiums. In asset allocation, because the characteristics of dangerous assets are mainly fixed-income assets, we can see the differences in investment strategies according to the comparable caliber of investment assets. Ping an equity assets are relatively high, while Taibao is the least and relatively conservative. Xinhua non-standard asset allocation is relatively high in 2019 or declined, and the fund utilization efficiency of Guoshou time deposit needs to be improved. From the perspective of investment income rate, the fluctuation of national debt interest rate and equity market is the main influencing factor. Since the proportion of maturing redistributed assets over the years is about 20-30%, the short-term fluctuation of treasury bond interest rate will not be too large, so the influence of treasury bond interest rate is relatively long-term. The relative fluctuation of net investment return is relatively small, while the fluctuation of equity market is the main influencing factor of total investment return, which is calculated according to the annual increase of 25% in Shanghai and Shenzhen 300. The total return on investment of insurance funds is about 5.5%, up 1.2 percentage points from 2018, and the insurance industry as a whole will receive a profit increase of about 200 billion.

1.3 the invisible black box of financial statements
Life insurance business is basically cross-year, and the profits of that year are not created by the flow of the current year, but by the stock of assets and liabilities. From the business point of view, the accounting profit of the insurance company = residual marginal release + risk marginal release + investment return deviation + operating experience deviation + accounting estimate change + net asset investment income. We can not clearly get the profit release and confirmation of the stock insurance policy through the current financial statements. Residual marginal release, marginal risk release, operational deviation, reserve adjustment caused by changes in actuarial assumptions are all included in the project of drawing reserves, which makes insurance companies have a lot of room for operation in practical processing, and at the same time leads to invisible "black box" in financial statements. IFRS17's adjustment to the structure of the income statement will open the "black box" so that we can see the source of profit more clearly. Before that, we need to understand the meaning of each project and how to identify, measure and amortize it.
1.3.1 the reserve contains the company's future profits
According to China's accounting standards CAS25, the original insurance contract reserves are divided into four categories. Life insurance liability reserve, long-term health insurance liability reserve and unexpired liability reserve respectively refer to "reserves for unterminated life insurance liability, long-term health insurance liability and non-life insurance liability", while outstanding indemnity reserve refers to "reserve for unsettled claims that have occurred in non-life insurance accidents". According to its nature, it can be directly divided into two categories: outstanding indemnity reserve and unexpired liability reserve, and the upcoming IFRS17 is divided according to this line of thinking, whether it is long-term insurance or short-term insurance, it is divided into "unexpired liability liabilities" and "outstanding indemnity liabilities". In the measurement of reserve, China's "relevant provisions on Accounting treatment of Insurance contract" requires the insurer to consider and measure the marginal factors separately when determining the reserve of insurance contract, and then use a systematic and reasonable method to include it into profit and loss during the insurance period. In addition, the provisions require that the profit cannot be recognized on the initial confirmation date of the insurance contract, and if a loss occurs, it shall be recognized and included in the profit or loss. Therefore, the formula for calculating the unexpired liability reserve is:
Undue liability reserve = reasonable estimated liability + risk margin + residual margin
Reasonable estimation of liabilities refers to the present value of the future net cash outflow of insurance companies; risk margin refers to the reserve set aside to deal with the uncertainty of expected cash flow, which is equivalent to a safety cushion, if the actual experience is better than the optimal estimation hypothesis, then this part will eventually be released into profits. The residual margin refers to the future profit implied in the insurance policy, because the first day profit cannot be recognized at the initial confirmation of the insurance contract, so it is included in the reserve and gradually amortized and released into the profit during the future insurance period. However, because our standards do not explain the connotation of marginal factors and lack of relevant guidelines, our insurance companies have too much autonomy in the measurement of marginal factors, which weakens the comparability among companies. at the same time, the diversity of measurement methods also reduces the understandability of accounting information.
1.3.2 residual marginal amortization drives more than 20% growth in pre-tax operating profit
Among the listed insurance companies, only Ping An Insurance disclosed the remaining marginal relevant data, pre-tax operating profit = residual marginal amortization + net asset investment income + interest margin income + operating deviation and so on. Ping an's pre-tax operating profit reached 98 billion yuan in 2018, of which the remaining marginal amortization was 62.3 billion yuan, contributing 64% of the pre-tax operating profit. The contribution level of remaining marginal amortization in 2016-2018 was 64%, which is the main source of accounting profit.
Under the current regulations, the remaining margin is locked at the time of initial measurement and will not be adjusted due to any changes in the estimate. the methods used for amortization during the future policy period are divided into insured carrier amortization and current price carrier amortization. The amortization rhythm of insured carriers is relatively stable, which is the main way adopted by listed companies at present.

According to the formula:
End-of-period residual margin = opening residual margin + new business residual margin + expected interest growth-residual marginal amortization + operating deviation and others
The surplus margin of new business is the main contribution subject of the current surplus marginal inflow, and the residual marginal amortization is the main influence subject of the current residual marginal outflow. The growth of the residual margin of new business mainly comes from the new business value. The difference between the two lies in the economic assumptions such as tax, cost of capital and discount rate. As we have explained in the 2019 annual strategy report "going through the interest rate cycle and keeping an eye on value growth", the ratio of new business value to new business residual margin is about 40%, so given the growth rate of NBV, we can predict the residual margin of new business. Thus the remaining marginal growth at the end of the period is expected. The proportion of the remaining marginal amortization release of Ping an in 2016-2018 accounted for 11.5% of the remaining marginal amortization at the beginning of the period, respectively. The proportion of residual marginal amortization in 2018 decreased because the new business contributed more than the residual margin in 2017 (37%). While the remaining marginal amortization ratio of new business contribution in 2018 is 29%, it is expected that the proportion of residual amortization in 2019 will be higher than 10.1%. We assume that the proportion of the remaining marginal amortization at the beginning of the period in 2019 and 2020 is 10.5%, and the growth rate of new business value is 15%. It is estimated that the remaining marginal amortization growth rates of Ping An Insurance at the end of 2019 and 2020 are 24% and 22%, respectively. the remaining marginal amortization increased by 28% and 24% respectively over the same period last year. According to the average proportion of residual marginal amortization to pre-tax operating profit, it is predicted that Ping an's pre-tax operating profit will grow by 27% and 24% in 2019 and 2020, respectively.

What are the changes brought about by IFRS17
2.1 change the recognition of revenue-squeeze out the revenue bubble
Under the current accounting standards, the premium income of insurance companies contains the unexpired liability reserve of long-term insurance, and the interest expense is not deducted from the investment income, thus exaggerating the operating income. after the implementation of IFRS17, the services provided by insurance companies are divided into insurance services and investment services. Insurance companies provide insurance services by selling insurance contracts and investment services by selling "investment parts of insurance contracts" or investment contracts. Therefore, the operating income of insurance companies is also divided into insurance income formed by the provision of insurance services and net investment income formed by the provision of investment services. According to IFRS17, even if the insurance contract has passed the major insurance risk test, it is still necessary to take out the investment part that meets certain conditions, which is measured according to IFRS9 and does not include the business income related to the provision of insurance services. Therefore, after the implementation of IFRS, the operating income of insurance companies will decline significantly.
2.2 transparency of the black box of debt
After the implementation of IFRS17, the unexpired liability reserve will be renamed to "undue liability liability", which mainly consists of three parts: future net cash outflow, risk adjustment and contract service margin, corresponding to the original reasonable estimated liability, risk margin and residual margin, respectively. At the same time, with the removal of the investment part of the insurance premium, the investment part of the corresponding liabilities will also be taken out into the "insured investment liabilities", so the long-term insurance liabilities will be greatly reduced in the future. It should be noted that the measurement of liabilities will also change, and the original residual marginal measurement is rigid, which will lead to the inability to truthfully reflect the residual profitability of the insurance contract group. and it will have an abnormal effect after the estimate changes. However, after that, the measurement of insurance contract service margin needs to be adjusted according to the changes of performance cash flow in each period (including changes in mortality assumptions, etc.).
In addition, the IFRS17 regulations on the discount rate of insurance contract liabilities have also changed greatly. Under the current accounting standards in China, the 750-day moving average treasury bond yield curve is used as the discount rate for traditional indemnificatory insurance, and the expected investment rate is used as the discount rate for investment insurance. In IFRS17, the current market discount rate is used for the performance cash flow, rather than the discount rate determined at the initial recognition of the contract group. It will further aggravate the volatility of financial performance and equity.

2.3 structural adjustment of income statement-- re-interpretation
At present, the structure of the income statement of insurance companies in China is the same as that of ordinary industries, that is, operating income minus operating expenditure gets operating profit, and then adds or subtracts non-operating income and expenditure to get total profit, minus income tax to get net profit. In IFRS17, the income statement is changed to be exposed in the form of profit sources, and the difference between reserves is split into various profit and loss accounts, which improves the transparency of profits. The profit of the income statement comes from two sources, namely, the underwriting profit brought by the insurance company's insurance service performance and the investment profit brought by the insurance company's investment performance, the sum of which is the final net profit. Under IFRS17, insurance income = expected compensation + risk adjustment and release + marginal release of contract services + acquisition cost amortization + other insurance service expenses. Investment income = investment income-interest on insurance liabilities. It clearly reflects the structure of Liyuan.
However, it should be noted that under the new standards, the impact of interest rate fluctuations on insurance liabilities increases, and profits may face greater fluctuations. In IFRS17, both fixed interest rate insurance liabilities and floating rate insurance liabilities adopt the same interest rate as the current observable market price, which will obviously increase the volatility of calculating the discount rate of fixed interest rate liabilities, and then increase the volatility of fixed interest rate liabilities. For the negative debt changes or insurance financial gains and expenses caused by changes in market interest rates, insurance companies can choose to directly include all of them in the current profits and losses or to apportion them, which may increase the volatility of profits.


III. From accounting statement to embedded value analysis
Due to the long term of the life insurance policy, it implies a large number of profits gradually realized in the future, while the conventional annual profit only reflects the release of profits in the current year and is not suitable to evaluate the value of life insurance companies. therefore, the embedded value is used to measure to make up for the one-sided accounting profits. The embedded value is to reflect the value created by all outstanding policies of the life insurance company for the shareholders of the company during the future insurance period as of the evaluation date. But it does not mean that our analysis of financial data is meaningless, and the embedded value is not completely independent of the accounting statements, the two still have a certain relationship and interaction.
3.1 critical connections-New Business
When calculating the embedded value, life insurance companies usually use the formula "embedded value = adjusted net assets (ANAV) + effective business value (VIFB) after deducting the required cost of capital". The adjusted net asset is the required capital plus free surplus corresponding to the applicable business, which is the adjustment of the after-tax difference between the market value and the book net asset value and the tariff difference of some liabilities; the effective business value is the present value after discounting the future statutory after-tax profits of the effective business at a certain discount rate. Whether it is the growth of profit or the growth of embedded value, the starting point comes from the growth of new business. The logical relationship shown in the following figure shows that the new single premium is processed and calculated through two sets of logic. Eventually, it will enter the embedded value system and the accounting statement system, respectively, contributing the embedded value and accounting profit, while the accounting profit will contribute to the net assets in the form of undistributed profit. There is a relationship between indirect and embedded value. Therefore, when we track the data of the insurance industry, new premiums and new business value are very important observation indicators, and profits will be distorted by various factors. however, the growth of new business value can basically truly reflect the operating situation of insurance companies in that year, and the growth level of embedded value can basically be determined when the expected return is endogenous and stable.


The difference between value and surplus margin lies in the discount rate, taxes and the cost of capital. Whether it is the new business value and the new business residual margin, or the effective business value and the effective business residual margin, the main differences are as follows: (1) the use of the discount rate: when calculating the value, the risk discount rate is used (11%). The remaining margin is based on the yield of treasury bonds and the rate of return on investment, and the discount rate is generally 5% to 5.5%. (2) when calculating value, it is necessary to consider the difference between tax and the cost of capital, while the residual margin does not take into account the difference between tax and cost of capital. Therefore, although they all represent the present value of future profits, there is a big difference between them because of the above two differences.

3.2 growth factors of embedded value
The above formula looks at the embedded value from the point of view of time point stock, and then from the point of view of period increment, according to the formula: end-of-period embedded value = initial embedded value + expected return of embedded value + new business value + investment and operating deviation, etc., so the two stable factors that determine the growth of embedded value are the expected return of embedded value and the value of new business. In addition, the uncertainties caused by operational experience differences, investment return differences and hypothesis adjustment should be taken into account.

3.2.1 New Business value-indicator of growth
Booming supply and demand is the basis for the growth of new single premiums. The new business value is jointly determined by the new order premium and the new business value rate. On the one hand, the growth of the new single premium depends on the market demand. According to Swiss re sigma data, the current insurance depth in China is only 4.4%, and the density is only US $390.5, which is still lower than the whole ball data of 6.13%, US $649.8, and far lower than the 7.76% and US $3516.7 level of developed countries. If we take the insurance density of developed countries as the target, China's premium income still has nearly 9 times the growth space. assuming that the development time is 10-15 years, the compound growth rate of insurance premium can still reach 16% 25%. Over the past 10 years, the average compound growth rate of China's life insurance industry is about 18%. According to the current security gap and market space, we have reason to believe that the premium growth rate can maintain a compound growth rate of 15% for at least 10 years. On the other hand, the growth of new single premiums depends on the agent sales capacity of the supply side under the trend of large-scale insurance industry. in the previous article, we have made a relevant analysis on agent growth and agent production capacity. the improvement of per capita production capacity of agents is the key factor for the growth of premiums in the future, so we need to pay attention to the quality construction of agents.


Product structure optimization to improve the rate of new business value. The value rate of new business is basically determined by the product strategy. according to the data disclosed by Ping An Insurance, the value rates of different types of insurance are as follows: long-term protection > long-term savings > short-term savings. The new business value rate of long-term guaranteed products remains above 80%, reaching 95% in 2018, much higher than other types of insurance, while the value rate of short-term guaranteed savings mixed products is less than 20%. From the perspective of the new business value rate of listed insurance companies, the overall growth trend with the passage of time, which is closely related to the adjustment of insurance product structure. New China Life Insurance's NBV Margin rose the fastest, from 22.4% in 2016 to 47.9% in 2018, making it the company with the highest rate of new business value among listed insurance companies. The proportion of long-term products has increased rapidly since 2013, of which the proportion of long-term health insurance has increased significantly from 7% to 32%, which is the main reason for the rapid growth of NBV Margin.


NBV expects double-digit growth for the whole year. Judging from the growth of NBV in previous years, due to the substantial growth of NBV in 2016 due to the influence of the second generation of compensation, and the slowdown in premium growth in 2018, the growth rate of new business value of insurance companies reached the bottom. The compound growth rate from 2013 to 2018 is Ping An Insurance (31.8%) > China Pacific Insurance (29.3%) > New China Life Insurance (23.6%) > China Life Insurance Company Limited (18.4%). Only China Life Insurance Company Limited is less than 20%, so in terms of growth, Ping an and Tai Bao are more superior. Judging from the situation in the first quarter of 2019, after the adjustment and adaptation period in the past year, listed insurance companies began to clarify their strategies and positioning gradually, and their good performance in the first quarter exceeded market expectations. China Life Insurance Company Limited and Ping An Insurance achieved NBV growth of 28.3% and 6.3% respectively compared with the same period last year. At the same time, the strategic differentiation trend of each organization is also gradually reflected. The strategy dominated by affordable products will gradually release increments throughout the year, so NBV will show a trend of low before and then high, while China Life Insurance Company Limited will not be able to maintain the same high growth rate in the first quarter of the year, so it will gradually decline. According to the 30% growth rate of indemnificatory products and the single digit growth rate of savings products, the annual NBV growth rate of listed insurance companies is expected to reach 10% Rue 15%. Judging from the situation in the first quarter, Taibao is slightly under pressure.

3.2.2 included expected return on value-a safety cushion for steady growth of value
The expected return of the initial embedded value is that at a certain evaluation point, the initial stock contains the added value of itself, including two parts: the expected return on the effective business value and the expected return on net assets. The part of net assets increases according to the expected rate of return on investment, which is generally about 5%. Effective business value refers to the sum of the present value of future profits of all outstanding policies (deducting the cost of required capital). The number of time periods of the discount factor decreases, so this part will release increments year by year, and the overall discount rate will increase according to the included value evaluation. At present, the discount rates adopted by the four listed companies are Ping an and Taibao 11%, Guoshou 10% and Xinhua 11.5%. The higher the discount rate is, the lower the effective business value is, but the higher the upper limit for the expected return growth of effective business value each year is. In addition, due to EV=ANAV+VIFB, the growth rate of embedded value will be between the rate of return on investment and the discount rate, and the greater the proportion of effective business value to the embedded value, the closer the growth rate of embedded value is to the discount rate.
The stable release of the expected return of the embedded value provides a safety cushion for the growth of the embedded value, that is to say, even if the new business value has zero growth rate, the embedded value will still maintain positive growth, and the zero growth of new business value is the bottom line of all companies. Everyone should work hard to be positive, so the positive growth of embedded value is certain.

3.2.3 ROEV is an important observation index
ROEV is an indicator of the growth of embedded value that the company can obtain relatively steadily after excluding the influence of short-term fluctuations. according to Ping an, the factors included in ROEV include the expected return of embedded value at the beginning of the period, the contribution of new business value, as well as changes in hypothetical models related to operations, empirical deviations, and so on. According to a unified calculation, the ROEV level of listed insurance companies over the years is between 15% and 25%, of which Ping an has an excellent ROEV of more than 30% in the past two years. According to the 5-year average data, the ROEV growth rate is Ping An Insurance (25.2%) > China Pacific Insurance (21.9%) > New China Life Insurance (18.3%) > China Life Insurance Company Limited (18.2%).


3.2.4 ROEV calculation under different growth rates of NBV
Regardless of the adjustment of assumptions and the influence of changes in uncertain factors such as empirical bias, investment bias and dividends, the growth of embedded value is basically determined by the growth rate of NBV and the expected rate of return of embedded value, while the annual increase of NBV will contribute effective business value and thus contribute to the expected return. When making the NBV growth assumption, we need to distinguish between two situations. When the 1:NBV growth rate is higher than the effective business value release rate, we can analyze it under the fixed expected rate of return assumption, because the increase in new business value can ensure the growth of effective business value, so that the expected rate of return will not deviate significantly from the effective business value discount rate for a long time. 2:NBV growth rate
Scenario 1: assuming that the expected rate of return of the embedded value is fixed at 10%, NBV increases year by year at a fixed growth rate, and the contribution of the new business value in T0 accounts for 10% of the embedded value, the growth of the embedded value is calculated under different NBV growth assumptions, as can be seen from the following figure:
When the NBV growth rate is higher than the expected rate of return of the embedded value, the EV growth rate will eventually converge to the NBV growth rate after a long enough time, and the NBV acceleration will play a leading role in the EV growth rate.


Case 2: assuming that the NBV growth rate is zero and maintain the 2018 level for a long time, we use the actual data of various insurance companies to calculate, and the return on investment is false.
Set to 5%, the discount rate is 11% for Ping an and Tai Bao, 11.5% for Xinhua and 10% for Guoshou. The conclusions are as follows:
If NBV growth is zero in 2019, the ROEV of the four insurance companies will be 24%, 19%, 15% and 14%, respectively. (do not consider uncertainties such as changes in assumptions and operational deviations)
Under the pessimistic expectation that the NBV growth rate will always be zero, the EV growth rate of insurance companies will gradually decline and finally converge to the assumption of investment return. When the EV growth rate drops below 10%, it has basically lost its growth. According to the data, the EV growth rates of China Life Insurance Company Limited, New China Life Insurance, China Pacific Insurance and Ping An Insurance will successively drop to less than 10%, which will take 9 years, 10 years, 13 years and 15 years respectively.

3.2.5 interference increases the volatility of EV performance
Since the beginning of the period contains the expected return of value and the new business value is calculated based on certain assumptions, it should be adjusted according to the actual situation and experience at the end of the period. Interference projects mainly include assumptions and model changes, operational experience differences and investment return differences. As can be seen from the data table, one of the most disturbing items is the "difference in investment return". There is a high correlation between the performance of investment return and the equity market, so the difference between investment return and hypothesis fluctuates greatly. The overall performance is better than the assumption of investment return, and the degree of positive contribution to the embedded value is Ping an > Xinhua > Taibao > Guoshou. The impact of operational assumptions and model changes is basically negative, and operational experience basically makes a positive contribution to the embedded value, indicating that the actual policy operating capability is better than the empirical hypothesis, and the two combined calculations, excluding the impact of the second generation of compensation in 2017-2018, the average positive contribution to the embedded value from 2017 to 2018 is Ping an > Xinhua > Taibao > Guoshou.

IV. Valuation and Investment suggestions
Since 2013, most of the listed insurance companies' P/EV has been in the range of 1-1.5X. Since 2019, except for Ping an, the valuation of the other three insurance companies is only about 0.8 times P/EV, which is in a historically low position.

According to the model, we predict that the embedded value per share of the four companies in 2019 is Ping An Insurance 66.7yuan, New China Life Insurance 65.5yuan, China Pacific Insurance 43.2yuan and China Life Insurance Company Limited 32.3yuan respectively. According to the evaluation value model, AV=EV+ n*NBV, the evaluation value of the enterprise also needs to consider the present value of the value created by the future new business at the evaluation time point. We assume that the annual growth rate of NBV is 8%. Considering the impact of the new business value in the next 10 years, the price multiple of the new business is about 8.6. The estimated values per share of Ping an, Taibao, Xinhua and Guoshou are 104,72,103 and 49 yuan respectively, and the P/AV multiples corresponding to the current share price are 0.8,0.5,0.51 and 0.55 respectively, and the rising space based on the current stock price is 25,99,98 and 82 respectively.
We insist on being optimistic about the investment value of insurance stocks. based on the previous analysis, 1. The insurance industry is still in the stage of rapid development, with demand and supply supporting the growth of premium income and increasing agent production capacity; 2. In the transformation of product structure, safeguard products develop rapidly, product value increases, and underwriting profitability continues to improve. 3. The investment side benefits from the improvement of the equity market, the rate of return on investment is significantly higher than that of last year, and the regulatory policy intends to further relax the equity investment; 4, the expected return of embedded value is released steadily year by year, superimposed with the contribution of new business value. The embedded value of insurance companies is expected to grow steadily at a double-digit rate. 5. the valuation is at an all-time low, and there is more room for the stock price to rise.


Risk hint
The risk of interest rate fluctuation, the growth of agent scale is less than expected, and Sino-US trade friction.