
Guizhou Wire Rope's (SHSE:600992) Earnings Growth Rate Lags the 30% CAGR Delivered to Shareholders
Guizhou Wire Rope's (SHSE:600992) Earnings Growth Rate Lags the 30% CAGR Delivered to Shareholders
Guizhou Wire Rope Incorporated Company (SHSE:600992) shareholders have seen the share price descend 15% over the month. But in three years the returns have been great. In fact, the share price is up a full 116% compared to three years ago. After a run like that some may not be surprised to see prices moderate. Only time will tell if there is still too much optimism currently reflected in the share price.
貴州省鋼絲繩股份有限公司(上海證券交易所:600992)股東們看到股價在一個月內下跌了15%。但在三年的時間裡,回報一直很高。事實上,與三年前相比,該公司股價足足上漲了116%。在經歷了這樣的漲勢後,一些人可能不會對價格放緩感到驚訝。目前反映在股價中的樂觀情緒是否仍然過多,只有時間才能證明。
While the stock has fallen 9.1% this week, it's worth focusing on the longer term and seeing if the stocks historical returns have been driven by the underlying fundamentals.
儘管該股本週下跌了9.1%,但值得關注的是更長期的,看看這些股票的歷史回報是否受到了基本面因素的推動。
Check out our latest analysis for Guizhou Wire Rope
查看我們對貴州鋼絲繩的最新分析
There is no denying that markets are sometimes efficient, but prices do not always reflect underlying business performance. By comparing earnings per share (EPS) and share price changes over time, we can get a feel for how investor attitudes to a company have morphed over time.
不可否認,市場有時是有效的,但價格並不總是反映潛在的商業表現。通過比較每股收益(EPS)和股價隨時間的變化,我們可以感受到投資者對一家公司的態度隨著時間的推移發生了怎樣的變化。
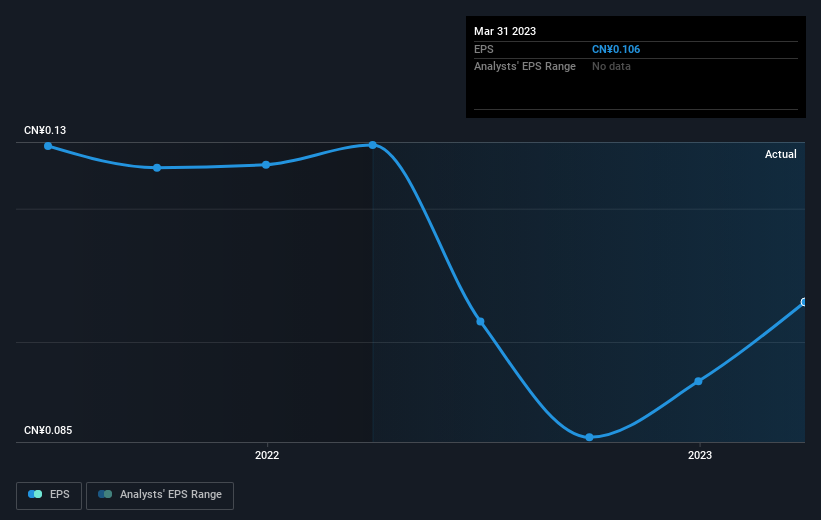
Guizhou Wire Rope was able to grow its EPS at 15% per year over three years, sending the share price higher. In comparison, the 29% per year gain in the share price outpaces the EPS growth. This indicates that the market is feeling more optimistic on the stock, after the last few years of progress. It's not unusual to see the market 're-rate' a stock, after a few years of growth. This optimism is also reflected in the fairly generous P/E ratio of 151.57.
貴州鋼絲繩能夠在三年內以每年15%的速度增長每股收益,推動其股價走高。相比之下,股價每年29%的漲幅超過了每股收益的增長。這表明,在經歷了過去幾年的上漲後,市場對該股的看法變得更加樂觀。在經歷了幾年的增長後,市場對一隻股票進行重新評級的情況並不少見。這種樂觀情緒也反映在151.57的相當慷慨的本益比上。
You can see below how EPS has changed over time (discover the exact values by clicking on the image).
您可以在下面看到EPS是如何隨著時間的推移而變化的(通過單擊圖像來了解確切的值)。
This free interactive report on Guizhou Wire Rope's earnings, revenue and cash flow is a great place to start, if you want to investigate the stock further.
這免費如果你想進一步調查貴州鋼絲繩的股票,關於貴州鋼絲繩收益、收入和現金流的互動報告是一個很好的起點。
A Different Perspective
不同的視角
We regret to report that Guizhou Wire Rope shareholders are down 27% for the year (even including dividends). Unfortunately, that's worse than the broader market decline of 9.4%. However, it could simply be that the share price has been impacted by broader market jitters. It might be worth keeping an eye on the fundamentals, in case there's a good opportunity. On the bright side, long term shareholders have made money, with a gain of 17% per year over half a decade. It could be that the recent sell-off is an opportunity, so it may be worth checking the fundamental data for signs of a long term growth trend. You could get a better understanding of Guizhou Wire Rope's growth by checking out this more detailed historical graph of earnings, revenue and cash flow.
我們遺憾地報告,貴州鋼絲繩股東全年下跌27%(即使包括股息)。不幸的是,這比大盤9.4%的跌幅還要糟糕。然而,這可能只是因為股價受到了更廣泛的市場緊張情緒的影響。也許有必要關注基本面,以防出現良機。從好的方面來看,長期股東已經賺到了錢,過去五年的年回報率為17%。最近的拋售可能是一個機會,因此可能值得查看基本面數據,以尋找長期增長趨勢的跡象。通過查看這張更詳細的收益、收入和現金流歷史圖表,您可以更好地瞭解貴州鋼絲繩的增長。
If you would prefer to check out another company -- one with potentially superior financials -- then do not miss this free list of companies that have proven they can grow earnings.
如果你更願意看看另一家公司--一家財務狀況可能更好的公司--那麼不要錯過這一點免費已證明自己能夠實現盈利增長的公司名單。
Please note, the market returns quoted in this article reflect the market weighted average returns of stocks that currently trade on Chinese exchanges.
請注意,本文引用的市場回報反映了目前在中國交易所交易的股票的市場加權平均回報。
Have feedback on this article? Concerned about the content? Get in touch with us directly. Alternatively, email editorial-team (at) simplywallst.com.
This article by Simply Wall St is general in nature. We provide commentary based on historical data and analyst forecasts only using an unbiased methodology and our articles are not intended to be financial advice. It does not constitute a recommendation to buy or sell any stock, and does not take account of your objectives, or your financial situation. We aim to bring you long-term focused analysis driven by fundamental data. Note that our analysis may not factor in the latest price-sensitive company announcements or qualitative material. Simply Wall St has no position in any stocks mentioned.
對這篇文章有什麼反饋嗎?擔心內容嗎? 保持聯繫直接與我們聯繫.或者,也可以給編輯組發電子郵件,地址是暗示Wallst.com。
本文由Simply Wall St.撰寫,具有概括性.我們僅使用不偏不倚的方法提供基於歷史數據和分析師預測的評論,我們的文章並不打算作為財務建議.它不構成買賣任何股票的建議,也沒有考慮你的目標或你的財務狀況.我們的目標是為您帶來由基本面數據驅動的長期重點分析.請注意,我們的分析可能不會將最新的對價格敏感的公司公告或定性材料考慮在內.Simply Wall St.對上述任何一隻股票都沒有持倉.
譯文內容由第三人軟體翻譯。