
 Yahoo Finance
 Some Investors May Be Worried About Mandarin Oriental International's (SGX:M04) Returns On Capital
Finding a business that has the potential to grow substantially is not easy, but it is possible if we look at a few key financial metrics. One common approach is to try and find a company with returns on capital employed (ROCE) that are increasing, in conjunction with a growing amount of capital employed. Put simply, these types of businesses are compounding machines, meaning they are continually reinvesting their earnings at ever-higher rates of return. Having said that, from a first glance at Mandarin Oriental International (SGX:M04) we aren't jumping out of our chairs at how returns are trending, but let's have a deeper look.
Return On Capital Employed (ROCE): What Is It?
For those that aren't sure what ROCE is, it measures the amount of pre-tax profits a company can generate from the capital employed in its business. The formula for this calculation on Mandarin Oriental International is:
Return on Capital Employed = Earnings Before Interest and Tax (EBIT) ÷ (Total Assets - Current Liabilities)
0.019 = US$65m ÷ (US$4.2b - US$759m) (Based on the trailing twelve months to June 2023).
Therefore, Mandarin Oriental International has an ROCE of 1.9%. In absolute terms, that's a low return and it also under-performs the Hospitality industry average of 4.3%.
Check out our latest analysis for Mandarin Oriental International
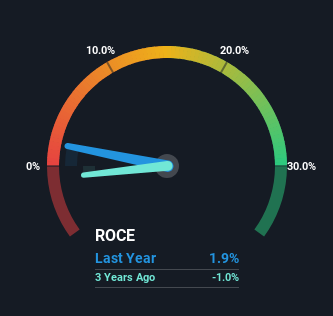
Historical performance is a great place to start when researching a stock so above you can see the gauge for Mandarin Oriental International's ROCE against it's prior returns. If you're interested in investigating Mandarin Oriental International's past further, check out this free graph of past earnings, revenue and cash flow.
How Are Returns Trending?
When we looked at the ROCE trend at Mandarin Oriental International, we didn't gain much confidence. Around five years ago the returns on capital were 4.5%, but since then they've fallen to 1.9%. However, given capital employed and revenue have both increased it appears that the business is currently pursuing growth, at the consequence of short term returns. And if the increased capital generates additional returns, the business, and thus shareholders, will benefit in the long run.
In Conclusion...
Even though returns on capital have fallen in the short term, we find it promising that revenue and capital employed have both increased for Mandarin Oriental International. These growth trends haven't led to growth returns though, since the stock has fallen 22% over the last five years. So we think it'd be worthwhile to look further into this stock given the trends look encouraging.
If you want to continue researching Mandarin Oriental International, you might be interested to know about the 1 warning sign that our analysis has discovered.
While Mandarin Oriental International may not currently earn the highest returns, we've compiled a list of companies that currently earn more than 25% return on equity. Check out this free list here.
Have feedback on this article? Concerned about the content? Get in touch with us directly. Alternatively, email editorial-team (at) simplywallst.com.
This article by Simply Wall St is general in nature. We provide commentary based on historical data and analyst forecasts only using an unbiased methodology and our articles are not intended to be financial advice. It does not constitute a recommendation to buy or sell any stock, and does not take account of your objectives, or your financial situation. We aim to bring you long-term focused analysis driven by fundamental data. Note that our analysis may not factor in the latest price-sensitive company announcements or qualitative material. Simply Wall St has no position in any stocks mentioned.
