
 Yahoo Finance
 Transmetro (ASX:TCO) Is Experiencing Growth In Returns On Capital
Finding a business that has the potential to grow substantially is not easy, but it is possible if we look at a few key financial metrics. Firstly, we'd want to identify a growing return on capital employed (ROCE) and then alongside that, an ever-increasing base of capital employed. Put simply, these types of businesses are compounding machines, meaning they are continually reinvesting their earnings at ever-higher rates of return. So when we looked at Transmetro (ASX:TCO) and its trend of ROCE, we really liked what we saw.
What Is Return On Capital Employed (ROCE)?
If you haven't worked with ROCE before, it measures the 'return' (pre-tax profit) a company generates from capital employed in its business. To calculate this metric for Transmetro, this is the formula:
Return on Capital Employed = Earnings Before Interest and Tax (EBIT) ÷ (Total Assets - Current Liabilities)
0.12 = AU$4.5m ÷ (AU$44m - AU$7.1m) (Based on the trailing twelve months to December 2022).
So, Transmetro has an ROCE of 12%. In absolute terms, that's a satisfactory return, but compared to the Hospitality industry average of 7.0% it's much better.
Check out our latest analysis for Transmetro
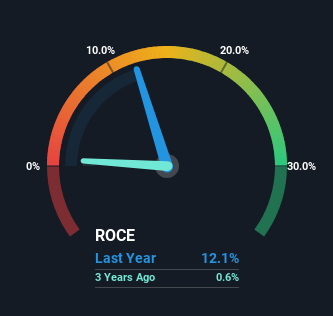
Historical performance is a great place to start when researching a stock so above you can see the gauge for Transmetro's ROCE against it's prior returns. If you'd like to look at how Transmetro has performed in the past in other metrics, you can view this free graph of past earnings, revenue and cash flow.
How Are Returns Trending?
Transmetro's ROCE growth is quite impressive. Looking at the data, we can see that even though capital employed in the business has remained relatively flat, the ROCE generated has risen by 128% over the last five years. So it's likely that the business is now reaping the full benefits of its past investments, since the capital employed hasn't changed considerably. It's worth looking deeper into this though because while it's great that the business is more efficient, it might also mean that going forward the areas to invest internally for the organic growth are lacking.
The Bottom Line On Transmetro's ROCE
In summary, we're delighted to see that Transmetro has been able to increase efficiencies and earn higher rates of return on the same amount of capital. And investors seem to expect more of this going forward, since the stock has rewarded shareholders with a 73% return over the last five years. Therefore, we think it would be worth your time to check if these trends are going to continue.
Since virtually every company faces some risks, it's worth knowing what they are, and we've spotted 4 warning signs for Transmetro (of which 2 are a bit unpleasant!) that you should know about.
While Transmetro may not currently earn the highest returns, we've compiled a list of companies that currently earn more than 25% return on equity. Check out this free list here.
Have feedback on this article? Concerned about the content? Get in touch with us directly. Alternatively, email editorial-team (at) simplywallst.com.
This article by Simply Wall St is general in nature. We provide commentary based on historical data and analyst forecasts only using an unbiased methodology and our articles are not intended to be financial advice. It does not constitute a recommendation to buy or sell any stock, and does not take account of your objectives, or your financial situation. We aim to bring you long-term focused analysis driven by fundamental data. Note that our analysis may not factor in the latest price-sensitive company announcements or qualitative material. Simply Wall St has no position in any stocks mentioned.
