Ossia International Limited's (SGX:O08) Stock Is Going Strong: Is the Market Following Fundamentals?
Most readers would already be aware that Ossia International's (SGX:O08) stock increased significantly by 60% over the past three months. Given the company's impressive performance, we decided to study its financial indicators more closely as a company's financial health over the long-term usually dictates market outcomes. Specifically, we decided to study Ossia International's ROE in this article.
Return on equity or ROE is an important factor to be considered by a shareholder because it tells them how effectively their capital is being reinvested. In short, ROE shows the profit each dollar generates with respect to its shareholder investments.
See our latest analysis for Ossia International
How Do You Calculate Return On Equity?
ROE can be calculated by using the formula:
Return on Equity = Net Profit (from continuing operations) ÷ Shareholders' Equity
So, based on the above formula, the ROE for Ossia International is:
18% = S$10m ÷ S$55m (Based on the trailing twelve months to March 2023).
The 'return' refers to a company's earnings over the last year. That means that for every SGD1 worth of shareholders' equity, the company generated SGD0.18 in profit.
Why Is ROE Important For Earnings Growth?
Thus far, we have learned that ROE measures how efficiently a company is generating its profits. Based on how much of its profits the company chooses to reinvest or "retain", we are then able to evaluate a company's future ability to generate profits. Assuming all else is equal, companies that have both a higher return on equity and higher profit retention are usually the ones that have a higher growth rate when compared to companies that don't have the same features.
Ossia International's Earnings Growth And 18% ROE
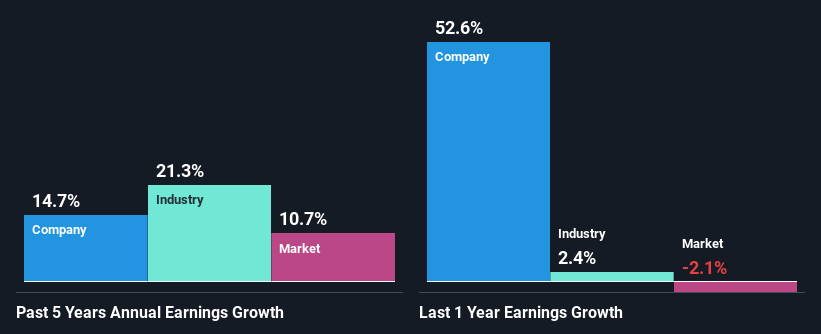
To begin with, Ossia International seems to have a respectable ROE. Especially when compared to the industry average of 9.1% the company's ROE looks pretty impressive. This probably laid the ground for Ossia International's moderate 15% net income growth seen over the past five years.
As a next step, we compared Ossia International's net income growth with the industry and were disappointed to see that the company's growth is lower than the industry average growth of 21% in the same period.
Earnings growth is an important metric to consider when valuing a stock. The investor should try to establish if the expected growth or decline in earnings, whichever the case may be, is priced in. Doing so will help them establish if the stock's future looks promising or ominous. If you're wondering about Ossia International's's valuation, check out this gauge of its price-to-earnings ratio, as compared to its industry.
Is Ossia International Using Its Retained Earnings Effectively?
Ossia International has a three-year median payout ratio of 45%, which implies that it retains the remaining 55% of its profits. This suggests that its dividend is well covered, and given the decent growth seen by the company, it looks like management is reinvesting its earnings efficiently.
Moreover, Ossia International is determined to keep sharing its profits with shareholders which we infer from its long history of five years of paying a dividend.
Summary
On the whole, we feel that Ossia International's performance has been quite good. In particular, it's great to see that the company is investing heavily into its business and along with a high rate of return, that has resulted in a respectable growth in its earnings. If the company continues to grow its earnings the way it has, that could have a positive impact on its share price given how earnings per share influence long-term share prices. Let's not forget, business risk is also one of the factors that affects the price of the stock. So this is also an important area that investors need to pay attention to before making a decision on any business. To know the 3 risks we have identified for Ossia International visit our risks dashboard for free.
Have feedback on this article? Concerned about the content? Get in touch with us directly. Alternatively, email editorial-team (at) simplywallst.com.
This article by Simply Wall St is general in nature. We provide commentary based on historical data and analyst forecasts only using an unbiased methodology and our articles are not intended to be financial advice. It does not constitute a recommendation to buy or sell any stock, and does not take account of your objectives, or your financial situation. We aim to bring you long-term focused analysis driven by fundamental data. Note that our analysis may not factor in the latest price-sensitive company announcements or qualitative material. Simply Wall St has no position in any stocks mentioned.
Join A Paid User Research Session
You’ll receive a US$30 Amazon Gift card for 1 hour of your time while helping us build better investing tools for the individual investors like yourself. Sign up here
