Hai Leck Holdings' (SGX:BLH) investors will be pleased with their 3.0% return over the last five years
It's possible to achieve returns close to the market-weighted average return by buying an index fund. But even in a market-beating portfolio, some stocks will lag the market. While the Hai Leck Holdings Limited (SGX:BLH) share price is down 25% over half a decade, the total return to shareholders (which includes dividends) was 3.0%. That's better than the market which declined 6.4% over the same time.
Since shareholders are down over the longer term, lets look at the underlying fundamentals over the that time and see if they've been consistent with returns.
See our latest analysis for Hai Leck Holdings
While markets are a powerful pricing mechanism, share prices reflect investor sentiment, not just underlying business performance. One way to examine how market sentiment has changed over time is to look at the interaction between a company's share price and its earnings per share (EPS).
While the share price declined over five years, Hai Leck Holdings actually managed to increase EPS by an average of 4.2% per year. Given the share price reaction, one might suspect that EPS is not a good guide to the business performance during the period (perhaps due to a one-off loss or gain). Or possibly, the market was previously very optimistic, so the stock has disappointed, despite improving EPS.
Based on these numbers, we'd venture that the market may have been over-optimistic about forecast growth, half a decade ago. Looking to other metrics might better explain the share price change.
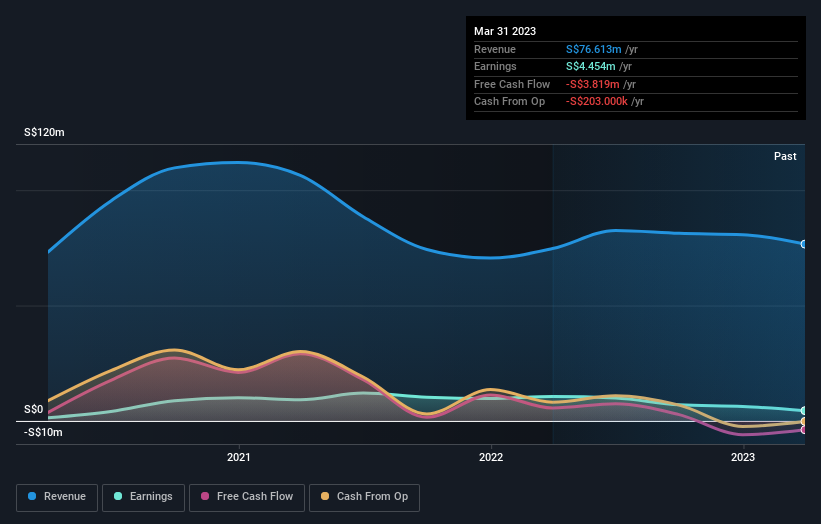
The revenue decline of 2.5% isn't too bad. But it's quite possible the market had expected better; a closer look at the revenue trends might explain the pessimism.
The graphic below depicts how earnings and revenue have changed over time (unveil the exact values by clicking on the image).
Balance sheet strength is crucial. It might be well worthwhile taking a look at our free report on how its financial position has changed over time.
What About The Total Shareholder Return (TSR)?
We've already covered Hai Leck Holdings' share price action, but we should also mention its total shareholder return (TSR). The TSR is a return calculation that accounts for the value of cash dividends (assuming that any dividend received was reinvested) and the calculated value of any discounted capital raisings and spin-offs. Hai Leck Holdings' TSR of 3.0% for the 5 years exceeded its share price return, because it has paid dividends.
A Different Perspective
Investors in Hai Leck Holdings had a tough year, with a total loss of 10%, against a market gain of about 2.4%. Even the share prices of good stocks drop sometimes, but we want to see improvements in the fundamental metrics of a business, before getting too interested. On the bright side, long term shareholders have made money, with a gain of 0.6% per year over half a decade. If the fundamental data continues to indicate long term sustainable growth, the current sell-off could be an opportunity worth considering. It's always interesting to track share price performance over the longer term. But to understand Hai Leck Holdings better, we need to consider many other factors. To that end, you should learn about the 3 warning signs we've spotted with Hai Leck Holdings (including 1 which can't be ignored) .
But note: Hai Leck Holdings may not be the best stock to buy. So take a peek at this free list of interesting companies with past earnings growth (and further growth forecast).
Please note, the market returns quoted in this article reflect the market weighted average returns of stocks that currently trade on Singaporean exchanges.
Have feedback on this article? Concerned about the content? Get in touch with us directly. Alternatively, email editorial-team (at) simplywallst.com.
This article by Simply Wall St is general in nature. We provide commentary based on historical data and analyst forecasts only using an unbiased methodology and our articles are not intended to be financial advice. It does not constitute a recommendation to buy or sell any stock, and does not take account of your objectives, or your financial situation. We aim to bring you long-term focused analysis driven by fundamental data. Note that our analysis may not factor in the latest price-sensitive company announcements or qualitative material. Simply Wall St has no position in any stocks mentioned.
Join A Paid User Research Session
You’ll receive a US$30 Amazon Gift card for 1 hour of your time while helping us build better investing tools for the individual investors like yourself. Sign up here
