
 80年代以来美货币政策整体宽松推动实体部门杠杆率大幅攀升。由10年期美债收益率与美国经济增长相对位置的变化评估,过去40年间美国货币政策整体仍偏向宽松。80年代到90年代中期10年期美债收益率高于美国名义GDP同比增速;90年代末到金融危机前10年期美债收益率逐步降至美国名义GDP同比增速下方、但仍高于美国实际GDP同比增速;金融危机后的十年间10年期美债收益率与美国实际GDP同比增速中枢基本持平。80年代以来货币政策整体宽松的同时美国实体经济部门杠杆率中枢不断上升,但通胀中枢仍波动式下滑。
Report summary
Why did the US Phillips curve fail?
We have divided the post-1960s into 6 segments: the 60s, 70s, 80s, 90s, 2001-2008, and after the financial crisis. According to the data, the US Phillips curve was only valid in the 1960s and 2001-2008 before the financial crisis, and the remaining four stages failed. We believe that the failure of the US Phillips curve is often the result of supply shocks, including the impact of technological progress and industrial transfer. The failure of the US Phillips curve after the financial crisis was due to changes in the trade structure leading to low input inflation and large-scale production of shale oil depressing the cost of energy use. Furthermore, it is worth noting that in the middle to late cycle stages of every round of the economy, when the US unemployment rate falls to a very low level, there will be a phased recovery in inflation. In other words, the significance of the Phillips curve is very limited in the long run, but the Phillips curve will return when the economy is in a late cycle.
Why hasn't America's monetary leniency triggered high inflation? The main causes may be industrial transfer, population structure, and social structure.
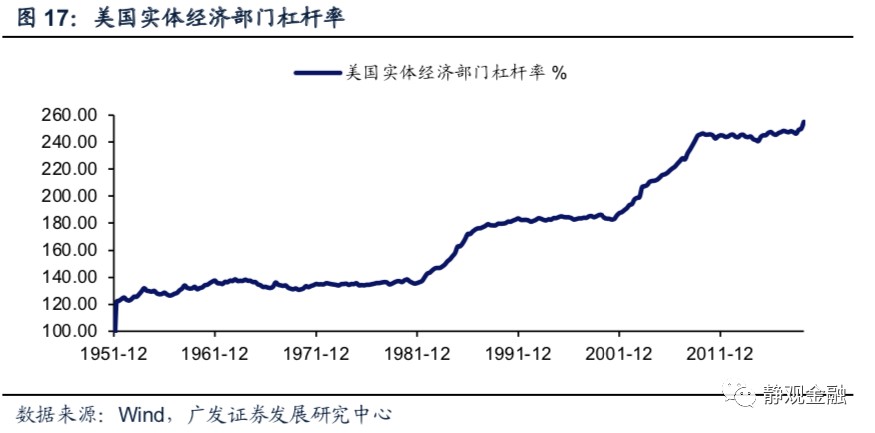
 Since the 80s, the overall easing of US monetary policy has contributed to a sharp rise in the leverage ratio of the real sector. Evaluating changes in the relative position of 10-year US Treasury yields and US economic growth, the overall US monetary policy over the past 40 years was still biased towards easing. The yield on 10-year US bonds from the 80s to the mid-90s was higher than the year-on-year growth rate of US nominal GDP; 10-year US bond yields from the late 90s to before the financial crisis gradually fell below the year-on-year growth rate of US nominal GDP, but were still higher than the year-on-year growth rate of US real GDP; 10-year US Treasury yields in the ten years after the financial crisis were basically the same as the year-on-year growth center of US real GDP. While monetary policy has been generally relaxed since the 80s, the leverage ratio center of the US real economy sector has continued to rise, but the inflation center has continued to fluctuate and decline.
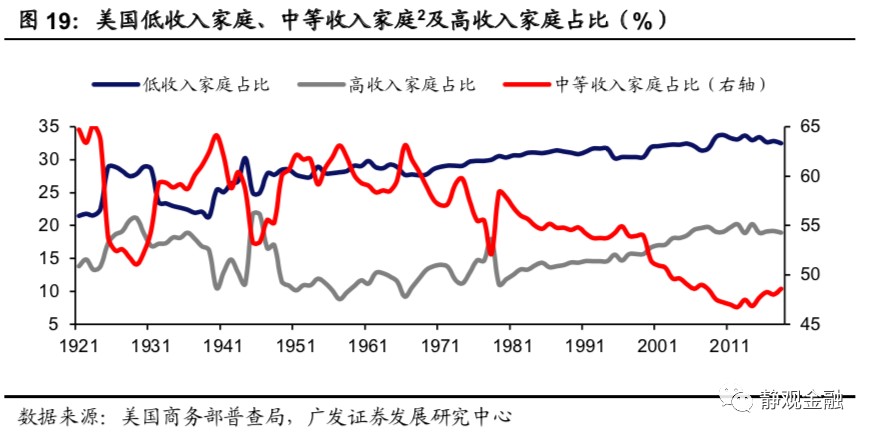
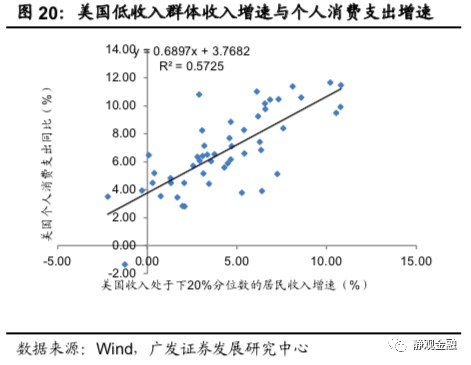
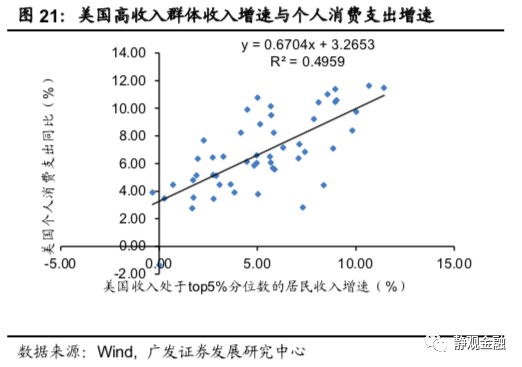
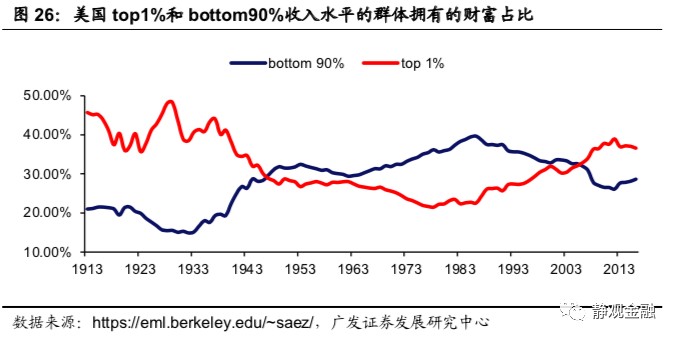
The failure of the US monetary easing to boost inflation may be due to three factors: global industrial shifts, an aging population, and the deepening polarization of society between rich and poor. First, global industrial transfers make it difficult for the added value of middle- and low-end finished products to rise, and import prices hinder the level of inflation. Since the 1960s, the per capita GDP growth rate weighted by global trade has been lower than the per capita GDP growth rate weighted by total economic volume for most of the time. It can be seen from this that, in the long run, global industrial shifts have depressed the production costs of low-end products and intensified the downward trend in the US inflation center. Furthermore, the polarization between rich and poor and aging has weakened the spending power of the US residential sector and curbed the level of inflation. With the year 80 as a watershed year, the degree of polarization between the rich and the poor in the US abated before, and intensified thereafter. The share of the middle class in the US has declined sharply in the past 40 years. This indicator was over 60% in the 60-70s of the last century, and now it is less than 50%. In fact, the overall spending power of the residential sector depends on low- and middle-income groups, so the pattern of differentiation between rich and poor in the US over the past 40 years has severely hampered its spending power. As far as the financial crisis is concerned, aging has further constrained the spending power of the US residential sector. However, weak consumption power is one of the main reasons why the core PCE of endogenous inflation in the US continues to decline from the center of endogenous inflation compared to the center.
The US is expected to experience further inflation in the next 10 years: the fourth round of industrial transfers will enter the second half; the growth rate of the labor force population will pick up; and the social structure is expected to reverse.
After the public health incident, the world entered the second half of the fourth round of industrial transfer, corresponding to the recovery process at the center of inflation. Although the US inflation center continues to shift downward over the long term, the US has a 20-year inflation cycle, which is probably related to the industrial transfer process. Each round of industrial transfer is divided into the first half and the second half, 10 years each. The first half corresponds to a weak capital expenditure cycle, depressing US and even global inflation; the second half corresponds to a strong capital expenditure cycle, gradually raising the US and even global inflation centers. After the impact of the public health incident, the world will enter the second half of the fourth round of industrial transfer after World War II. Since the recipient countries of this round of industrial transfer are small economies, this means that the US is likely to experience a re-inflation process after the global public health incident, but it is unlikely that high inflation will occur.
The working population has entered a period of recovery, and residents are expected to increase their leverage. According to OECD estimates, the growth rate of the US pan-labor force population aged 20-64 will enter a recovery period in 2023 and continue until 2041. Furthermore, the growth rate of the US population in the 20-49 home-buying age group was also picking up in 2017-2026. Furthermore, at present, the leverage ratio of the US government may be close to a bottleneck, and the leverage ratio of the non-financial enterprise sector has returned to an all-time high; only the leverage ratio of the residential sector is at a low level. It is expected that after the public health incident is over, the corporate sector may enter the stage of reducing leverage, while the residential sector is expected to enter a cycle of increasing leverage. Combined with the assessment of population factors, real estate is expected to become the long-term driving force of the US economy after the public health incident. The inflation centers are now moving upward during the period when US residents increase leverage and companies reduce leverage.
The social structure may be reversed in the next 10 years. There is a huge contrast between America's two party governing philosophies. The Democratic Party promotes social fairness, and the Republican Party advocates the pursuit of efficiency. The two parties have achieved their governing philosophy through fiscal and taxation policies. The Democratic Party is good at raising taxes, but “robs the rich and helps the poor,” and the Republican Party pushes for tax cuts and capital to seek profit. After World War I, the US re-chose “fairness” and “efficiency” twice, which occurred after the Great Depression and in 1980, respectively. As can be seen when the influence of the two parties alternated in power, American society's choices about “fairness” and “efficiency” depended on the social structure itself. The current degree of differentiation between rich and poor in the US is comparable to that of the Great Depression. This factor is likely to make the US election within this year or 2024 a critical time point for reversing the structure of American society. Once the US welcomes a Democratic president again, it is likely that it will enter a tax increase cycle, and the share of the US middle class is also expected to rise again. At that time, the spending power of the US residential sector will also gradually increase.
Main text
1. Why did the US Phillips curve fail
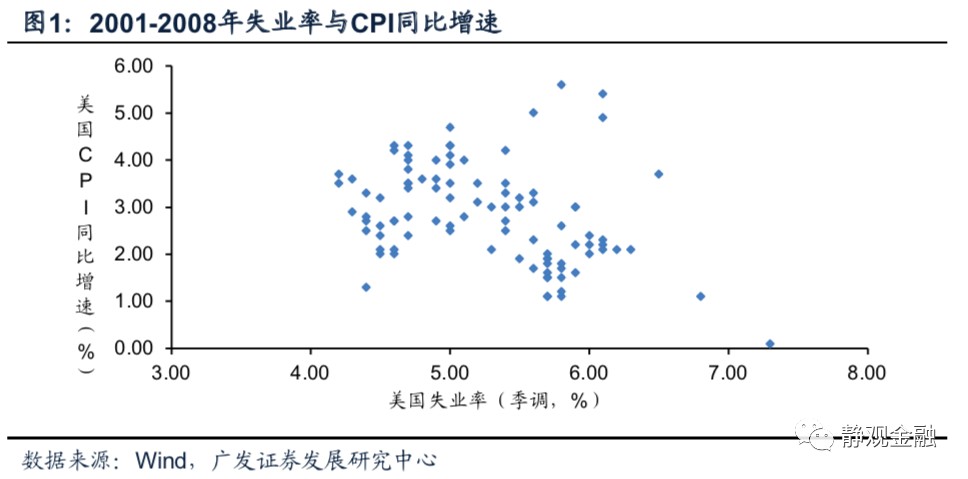
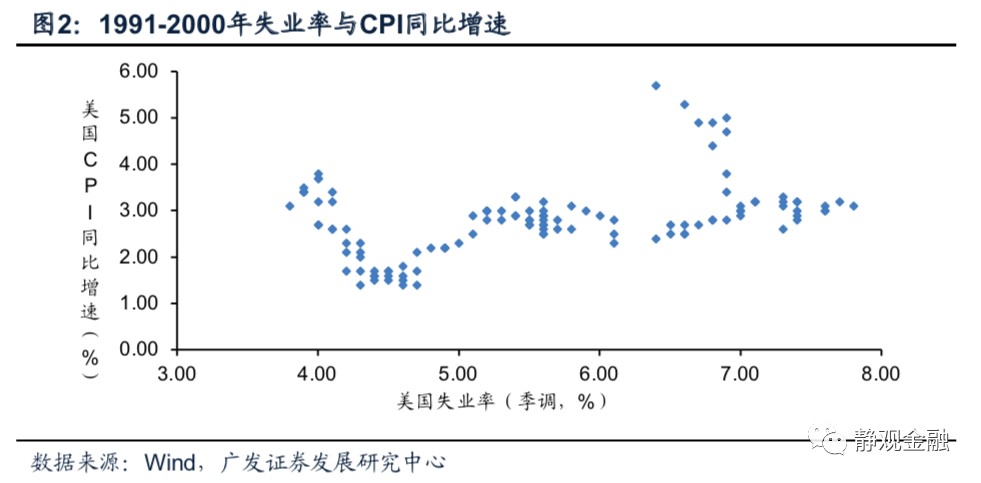
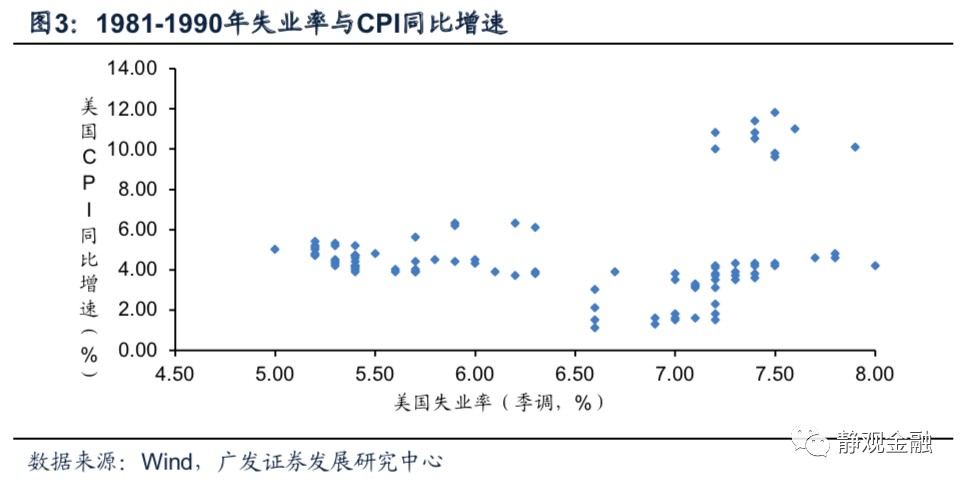
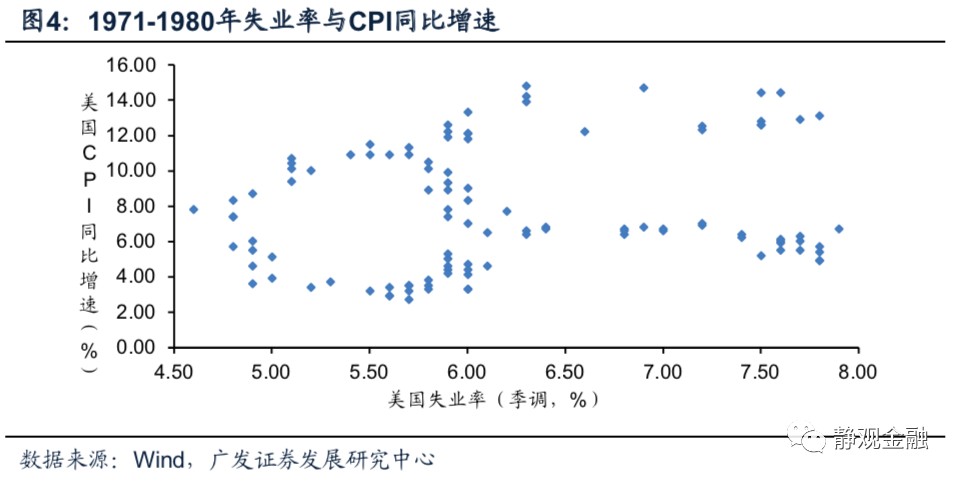
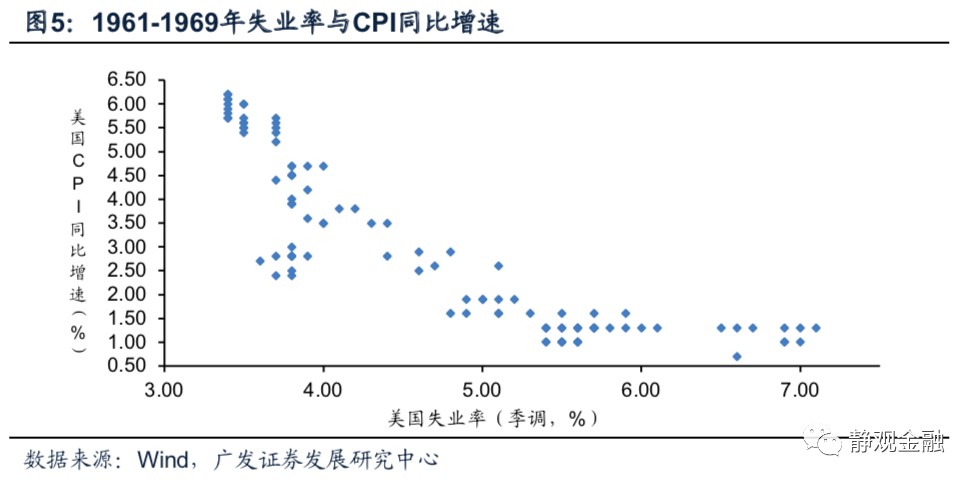
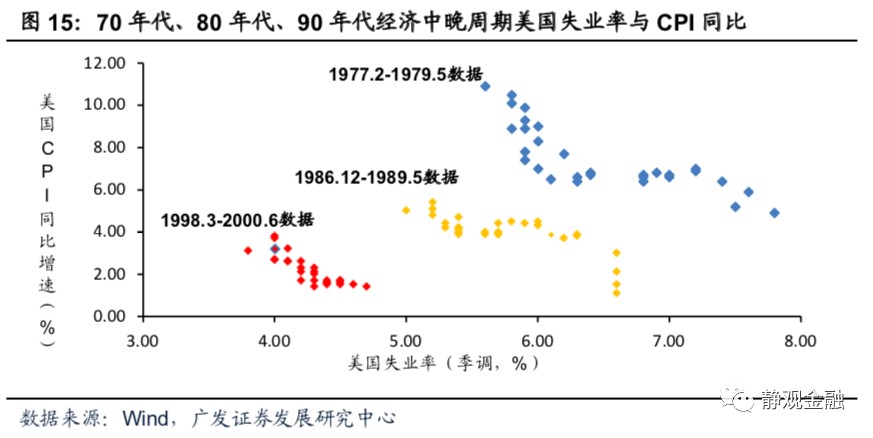
The Phillips curve tells the story of higher inflation triggered by falling unemployment. Logically, as the unemployment rate falls, cheap labor gradually becomes scarce, hourly wage growth begins to rise, and higher incomes will drive consumer demand, which in turn will cause inflation to rise. However, in the six decades since the 1960s of the last century, the US unemployment rate compared to CPI only showed significant negative correlation characteristics in the 60s and before the financial crisis (2001-2008). The Phillips curve in the 70s, 80s, 90s, and after the financial crisis all seemed to have failed. We believe that the failure of the US Phillips curve is often the result of supply shocks, including the impact of technological progress and industrial transfer. The failure of the US Phillips curve after the financial crisis was due to changes in the trade structure leading to low input inflation and large-scale production of shale oil depressing the cost of energy use.
Furthermore, it is worth noting that in the middle to late cycle stages of every round of the economy, when the US unemployment rate falls to a very low level, there will be a phased recovery in inflation. In other words, the significance of the Phillips curve is very limited in the long run, but the Phillips curve will return when the economy is in a late cycle.
(1) The validity and failure of the US Phillips curve since the 1960s
We have divided the post-1960s into 6 segments: the 60s, 70s, 80s, 90s, 2001-2008, and post-financial crisis (2009-2019). According to the data, the US Phillips curve only worked in the 1960s and 2001-2008 before the financial crisis, while the remaining four stages (70s, 80s, 90s, and after the financial crisis) all failed.
(2) The impact of the US employment environment on energy, housing and imported commodity price factors is limited
US CPI inflation is mainly affected by four factors: energy sub-category, housing sub-category (rent), imported commodity prices and other factors. Logically, although the energy factor accounts for a low share, it fluctuates greatly; in the CPI's second-tier subcategory, the residential segment has the highest weight, accounting for 33.5%; furthermore, the US inflation data as a consumer country will also be affected by import prices. Using only the year-on-year growth rate of the CPI energy segment (X1), the year-on-year growth rate of the CPI residential segment (X2), and the year-on-year growth rate of the import price index (1 month ahead, X3) to fit the US CPI year-on-year growth rate (Y), R2 = 83.5%, and the formula: Y=0.48*X1+0.05*X2+0.08*X3+0.69. In other words, the power of the three factors of energy, housing, and imported commodity prices to explain changes in the US CPI caliber of inflation has reached 83.5%. However, the influence of the US employment situation on the price factors mentioned above is weak. This is the main reason why the Phillips curve is not very effective.
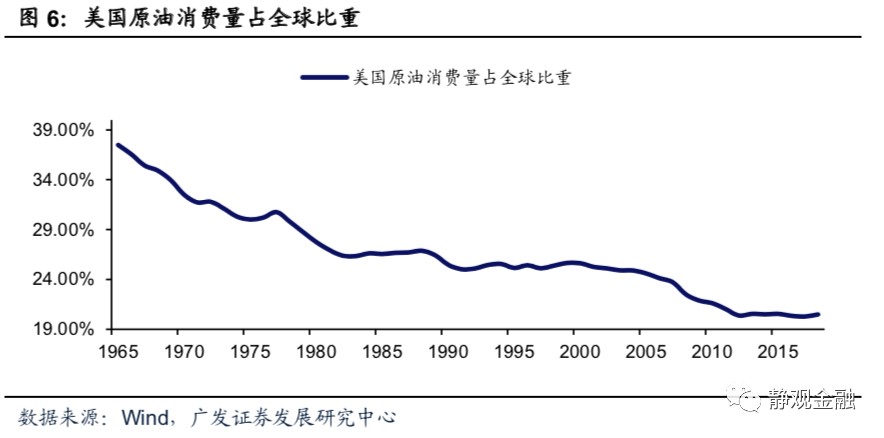
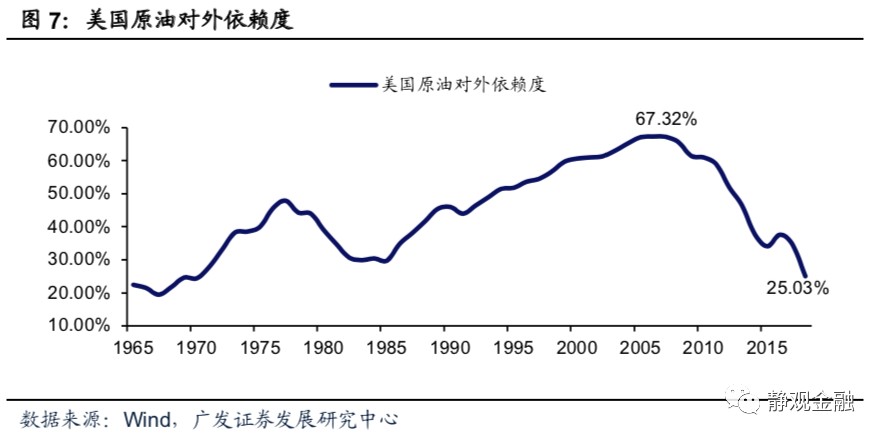
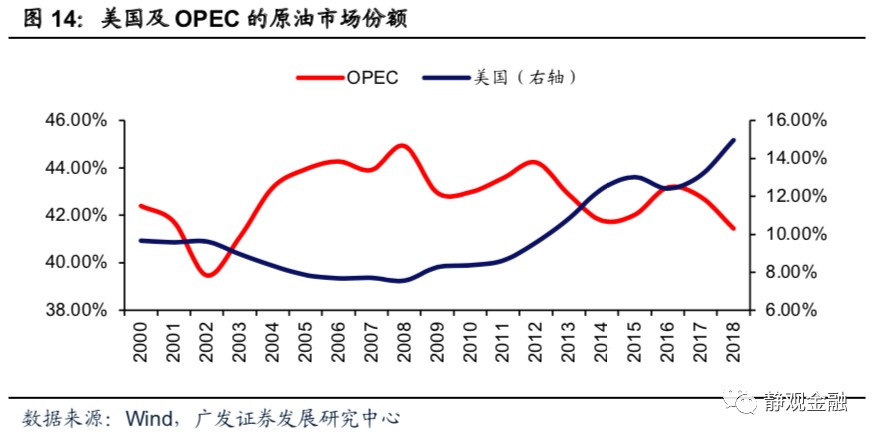
First, it is difficult for fluctuations in the US unemployment rate to have a trend effect on the year-on-year growth rate of crude oil prices. The US energy CPI segment is affected by crude oil prices, while the latter is mainly affected by the year-on-year growth rate of global fixed capital formation, transportation demand, and supply shocks. Since the 1960s of the last century, the share of US crude oil consumption in the world has continued to decline, and before large-scale production of shale oil in 2011, the external dependence of US crude oil has continued to rise. Therefore, changes in US domestic demand often have little weight on crude oil prices.
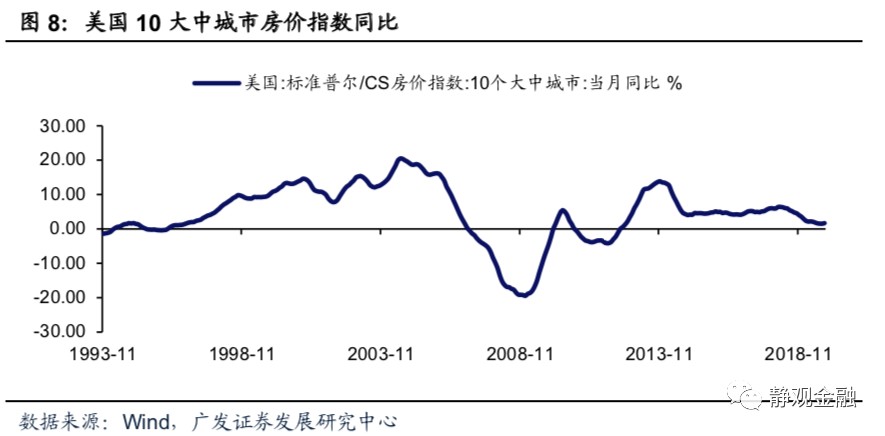
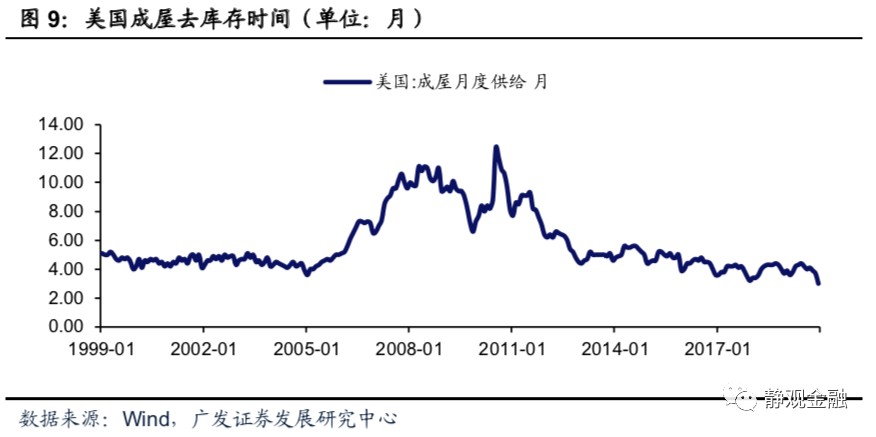
Furthermore, the US real estate cycle and the unemployment rate cycle are related to the long cycle and the medium cycle. The US CPI residency segment (rent) is mainly affected by the US real estate cycle. We used two variables to portray the year-on-year growth rate of US CPI housing rents (Y) using the inventory removal cycle of finished houses (24 months ahead, X1) and the housing price index of the 10 largest cities in the US (leading 18 months, X2), R2 = 71.9%, and obtained the formula: Y=-0.25*X1+0.04*X2+3.94. It can be seen from this that changes in the US CPI housing subcategory (rent) converge with the US real estate cycle. Logically, the US real estate cycle is the Kuznets cycle, which takes about 16-20 years; while the US unemployment rate synchronizes with the Jugla cycle, about every 7-10 years. Thus, changes in the US unemployment rate are not necessarily highly negatively correlated with changes in rents.

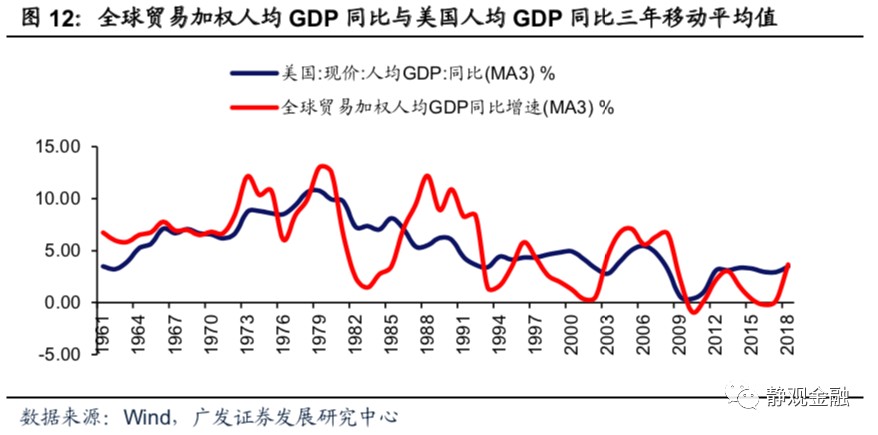
Finally, import prices are mainly affected by crude oil prices and labor costs, and are not sensitive to the US unemployment rate. Before large-scale production of shale oil, U.S. crude oil was highly dependent on the outside world, so oil prices had a great impact on import prices overall. Furthermore, we believe that the global trade structure will also have an impact on the import prices of the US and other countries. Each round of industrial transfer is a shift of middle- and low-end industries from countries/regions with high labor costs to countries/regions with low labor costs, so every round of industrial transfer also achieved a phased reduction in production costs. The global GDP per capita obtained by weighting the share of trade is more in line with the overall human cost of the world's finished products. Since the 1960s of the last century, the indicator's year-on-year growth rate has stagnated or even been negative eight times, which occurred in 1974, 1981-1982, 1993, 1997, 2000, 2009, 2012, and 2015, respectively. Coincidentally, since the 1960s of the last century, when the US Phillips curve was effective, there were no such years in the 1960s and 2001-2008, and the US Phillips curve failed in the era when per capita GDP growth weighted by global trade stagnated.
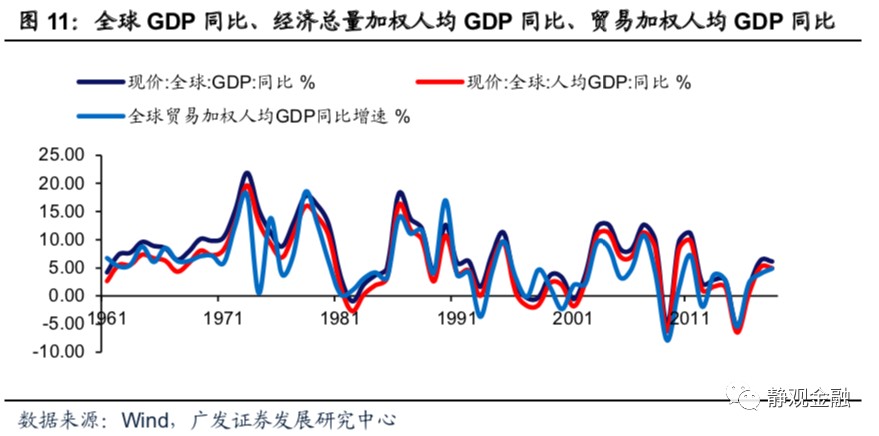
Furthermore, as shown in Figure 11, the year-on-year growth rate of per capita GDP weighted by total economic volume is highly correlated with the year-on-year growth rate of global GDP, but the year-on-year growth rate of global GDP weighted by trade often deviates from the year-on-year growth rate of global GDP. We think this deviation may be related to industrial transfers. Also, in the years (years) when global trade weighted per capita GDP growth was significantly lower than the US per capita GDP growth rate,The US Phillips curve may fail due to interference from import prices (low input inflation).
(3) The main reason for the failure of the US Phillips curve after the financial crisis: changes in trade structure and shale oil
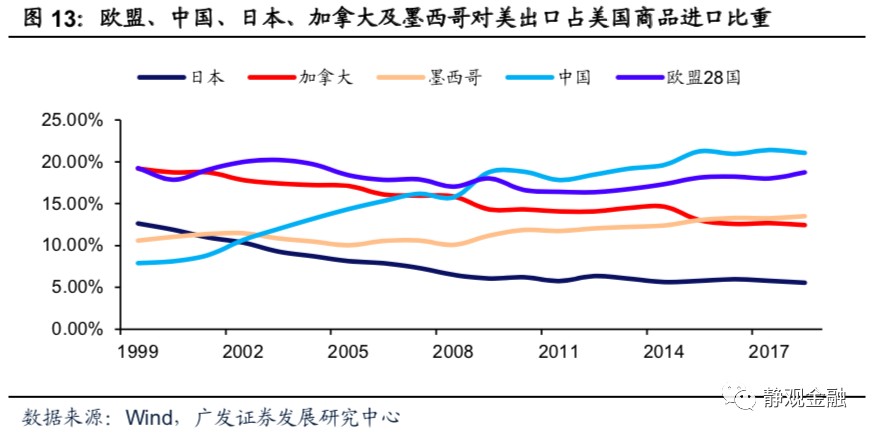
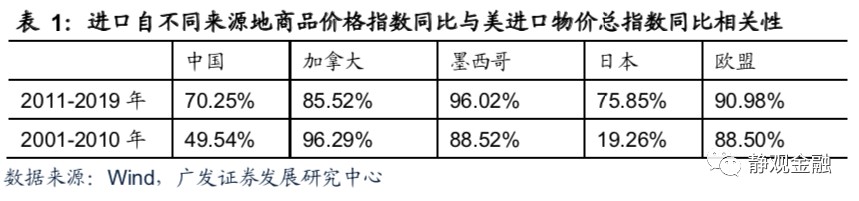
After the financial crisis, the US inflation index was “supply-side suppressed” by two structural factors: China replaced Canada and the European Union as America's largest trading partner, depressing US imported inflation; large-scale production of shale oil lowered the cost of energy use in the US and the world at large. In other words, after the financial crisis, China took on the global middle and high-end industries and the shale oil technology revolution depressed the US inflation center and caused the Phillips curve to fail.
(4) Each round of the economy's mid- to late-cycle Phillips curve will “show results” for a short time
Although looking at the 10-year dimension, the Phillips curve effect has only existed in the US in the 1960s and before the financial crisis (2001-2008) since the 1960s of the last century, and before the financial crisis (2001-2008), the Phillips curve in the late-cycle phase of each economic cycle will have a brief effect, and even this phenomenon may begin in the mid-cycle stage.
Looking at the long term, the main reason for the failure of the US Phillips curve is that supply-side costs continue to decline due to industrial transfers and technological progress. However, in the late economic cycle phase, the reappearance of the US Phillips curve may be related to three factors. First, under the pattern of trade integration, the global economy resonates. The late cycle of the US economy and the stage where the unemployment rate is extremely low also often corresponds to the economic boom period of non-US economies, especially emerging economies. At this stage, global demand is extremely strong, and the contribution of US import prices to inflation is rising. Second, commodities such as traditional crude oil and non-ferrous metals all have a 5-8 year supply cycle. Some commodities face insufficient supply in each round of the late economic cycle. Their price elasticity is extremely strong, making it easy to drive up global inflation. Finally, the US unemployment rate itself affects the prices of some endogenous services through hourly wages. In particular, when the unemployment rate is extremely low, consumer prices of services rise markedly, which also reinforces the characteristics of the late economic cycle Phillips curve. In summary, we can still appreciate that even when the US Phillips curve reappears during the late economic cycle phase, the logic does not simply stem from falling unemployment leading to an increase in hourly wage growth, which in turn pushes up inflation. The input inflation factor is still the key to rising US inflation at this stage.
2. Why did US monetary leniency not trigger high inflation? Industrial Transfer, Demographic Structure, and Social Structure
(1) The overall easing of US monetary policy since the 80s
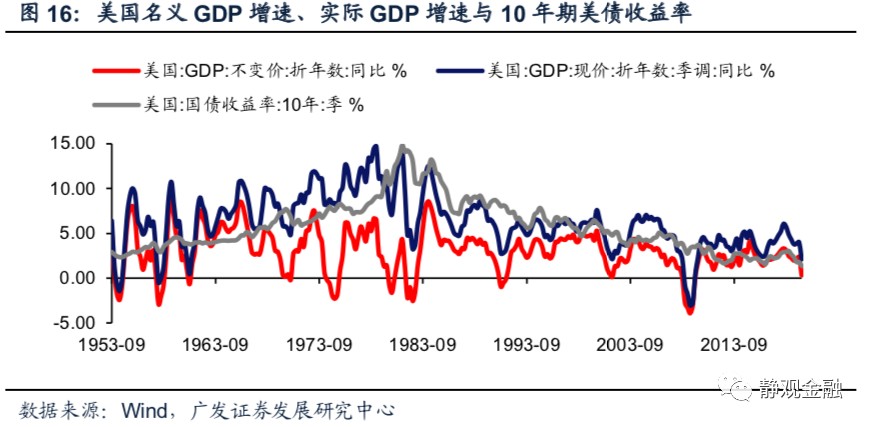
As Federal Reserve Chairman Powell explained at this year's Jackson Hole Global Central Bank Meeting, the Federal Reserve always made it its mission to prevent high inflation after the US experienced severe economic stagnation in the 70s. Every time the unemployment rate fell sharply and inflation indicators such as the core PCE reached target values, the Federal Reserve began to raise interest rates. However, based on the assessment of changes in the relative position of 10-year US Treasury yields and US economic growth, the overall US monetary policy over the past 40 years was still biased towards easing. The yield on 10-year US bonds from the 80s to the mid-90s was higher than the year-on-year growth rate of US nominal GDP; 10-year US bond yields from the late 90s to before the financial crisis gradually fell below the year-on-year growth rate of US nominal GDP, but were still higher than the year-on-year growth rate of US real GDP; 10-year US Treasury yields in the ten years after the financial crisis were basically the same as the year-on-year growth center of US real GDP.
(2) The failure of US monetary leniency to boost inflation may be due to three factors
Since the 80s, while monetary policy has been generally relaxed, the leverage ratio center of the US real economy sector has continued to rise, but the inflation center has continued to fluctuate and decline. We believe that the decline in the US inflation center over the past 40 years is the result of a resonance of three factors: global industrial shifts, an aging population, and the intensification of social differentiation between rich and poor.
1. Global industrial transfers make it difficult for the added value of middle- and low-end finished products to rise, and import prices hinder the level of inflation
Global industrial transfer is a process where the labor force of the original industrial country no longer has a comparative advantage, and middle- and low-end industries are transferred to economies with a certain industrial base that has a comparative advantage in the labor force. After World War II, the world has experienced three rounds of industrial transformation: in the 50s and 60s, America's middle- and low-end industries moved to countries such as Germany and Japan; in the 70s and 80s of the last century, the middle- and low-end industries of Japan and Germany moved to the Four Little Dragons of Asia [1]; and from the 90s of the last century to 2010, the global middle- and low-end industries moved to mainland China. Since then, the world is undergoing a fourth round of industrial transfer, that is, China's middle- and low-end industries are moving to ASEAN and other low- and middle-income economies, while China is undertaking the global middle and high-end industries.
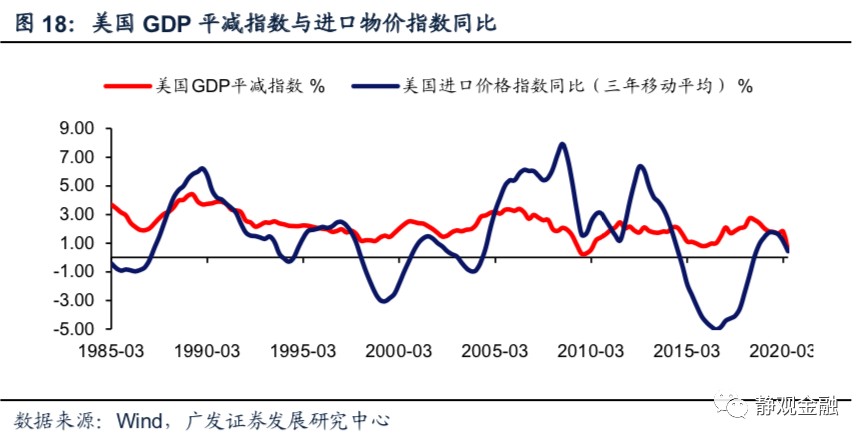
Industrial transfer countries are generally high-income or middle- to high-income countries, and recipient countries are generally low- and middle-income countries (not low-income countries) with a certain industrial base. Since the 1960s, the per capita GDP growth rate weighted by global trade shares has been lower than the per capita GDP growth rate weighted by the total economy for most of the time. As can be seen from Figure 11, the average annual increase in global trade share weighted per capita GDP from 1961 to 2018 was only 5.8%, while the average annual increase in the total global economy weighted per capita GDP was as high as 7.5%. It shows that in the long run, industrial transfers have depressed the production costs of low-end products and intensified the downward trend of the global inflation center, especially in high-income economies. As Figure 18 shows, the US import price index has been lower than the US GDP deflator index for most of the year since the 80s.
2. The polarization between rich and poor and aging has weakened the consumption capacity of the residential sector and curbed the level of inflation
With the year 80 as a watershed year, the degree of polarization between the rich and the poor in the US abated before, and intensified thereafter. The share of the middle class in the US has declined sharply in the past 40 years. This indicator was over 60% in the 60-70s of the last century, and now it is less than 50%. In fact, the overall spending power of the residential sector depends on low- and middle-income groups, so the pattern of differentiation between rich and poor in the US over the past 40 years has severely hampered its spending power. As far as the financial crisis is concerned, aging has further constrained the spending power of the US residential sector.
If immigration is not taken into account and assuming that the annual death rate of the US before 1960 was 0.5%, then as of 2018, the proportion of the US population in the 25-54 age group and the age group 55 and above was 37.5% and 30.7% respectively, up -2.8% and 5.4% from 2008, respectively, and -4.3% and 7.9% from 2000, respectively. As can be seen from changes in the proportion of the population of various ages, the degree of population aging in the US deepened markedly after the financial crisis. Among them, the share of the US labor force aged 55 and above increased by 6.0%, while the share of the labor force in the 25-54 age group decreased by 4.6%.
The gap in median per capita income for different age groups in the US is also significant. As of 2018, the median per capita income of the 15-24 age group, the 25-34 age group, the 35-44 age group, the 45-54 age group, the 55-64 age group, and the age group 65 and above in the US was 13,967 US dollars, 37133 US dollars, 45952 US dollars, 4,7088 US dollars, 3,9940 US dollars and 25,601 US dollars, respectively. In other words, the median per capita income of the 55-64 age group and the age group 65 and above was 84.8% and 54.4% of the median per capita income of the 45-54 age group, respectively. There is currently no hourly wage data for different age groups in the US, but based on differences in the median per capita income of different age groups, we have reason to believe that the difference in hourly wages of workers of different age groups is also significant. In other words, the possibility that the degree of aging deepened after the financial crisis was also the main reason for the weak hourly wage growth rate in the US.
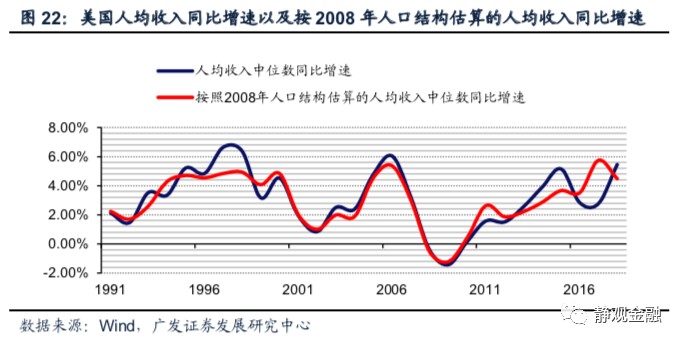
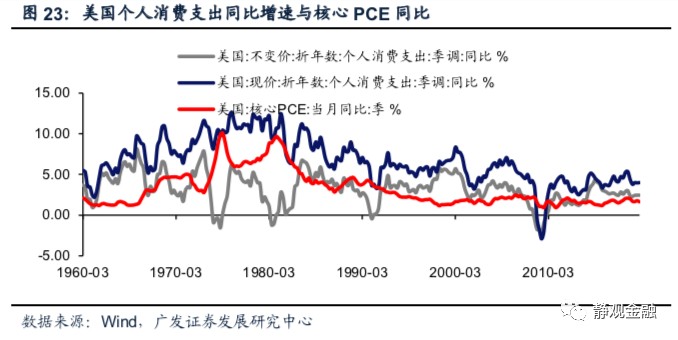
Since the 90s, the high year-on-year growth rate of the US median per capita income has declined by two degrees (6.7% in 1997, 6.0% in 2006, 5.5% in 2018), but the high year-on-year growth rate of the US median per capita income measured by the 2008 US population structure and median per capita income of various age groups has moved slightly higher (4.9% in 1998, 5.4% in 2006, 5.7% in 2017). The data further illustrates how aging after the financial crisis weakened the spending power of the US residential sector. However, weak consumption power is one of the main reasons why the core PCE of endogenous inflation in the US continues to decline from the center of endogenous inflation compared to the center.
(3) Over the past 40 years, America's monetary leniency has corresponded to financial asset inflation, exacerbating the polarization between rich and poor
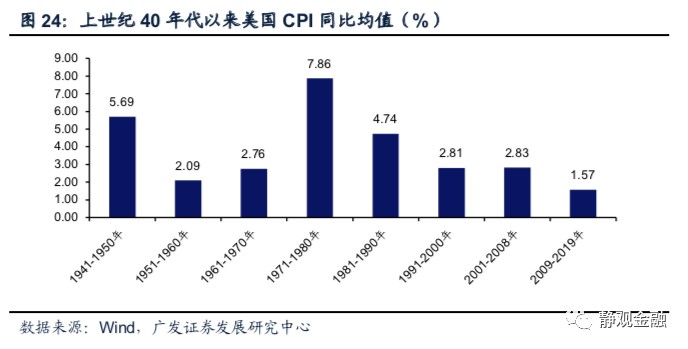
The S&P 500 index rose 2279.8% from 1981 to 2019, with an annualized yield of 8.5%; between 1987 and 2019, the housing price index of the top 10 US S&P/CS cities rose 268.2%, an annualized increase of 4.0%; the annual average of the US CPI from 1980 to 2019 was only 2.8% year-on-year. In other words, the decline in risk-free interest rates over the past 40 years has brought unprecedented valuation dividends to financial assets, but this process has further exacerbated the polarization between the rich and the poor.
3. The US is expected to experience further inflation in the next 10 years
(1) After the public health incident, the world entered the second half of the fourth round of industrial transfer
Although the US inflation center continues to shift downward over the long term, if data from the 70s is excluded (driven by specific factors such as the influence of baby boomers, the decoupling of the dollar from gold, and the oil crisis), the US has had a 20-year inflation cycle since the 40s. In fact, cyclical fluctuations in US inflation are related to the process of industrial transfer. We divided each round of industrial transfer into the first half and the second half, 10 years each. The first half of each round of industrial transfer means that the global production side cost center has declined significantly, and the industrial host country is in a period of slow rise in the urbanization rate, thereby lowering the global inflation center; after entering the second half, the global production side cost center will continue to rise, and the urbanization rate of the industrial host country will accelerate, and demand for real assets such as real estate will increase, thereby boosting the global inflation center. Furthermore, the size of the economy of the host country of the industry determines the extent to which the US inflation center fluctuates. If a large economy undertakes middle- and low-end production capacity, the US and even the world are likely to experience stagflation in the second half of the industrial transfer; if a small economy undertakes middle- and low-end production capacity, then the US and even the world will have only re-inflation and no high inflation in the second half of the industrial transfer.
Judging from the characteristics of global industrial transfers since the 1960s, every economic recession pushes global industrial transfer into a new stage. Since 2012, the world has ushered in the fourth round of industrial transformation after World War II: the production capacity of middle- and low-end manufacturing industries has shifted from mainland China to ASEAN. In the context of continuing globalization, after the impact of the public health incident, the world will enter the second half of the fourth round of industrial transfer after World War II. Since ASEAN is a small economy, this means that the US is prone to a re-inflationary process after public health events around the world, but it is unlikely that high inflation will occur.
(2) The working population has entered a period of recovery, and residents are expected to increase leverage
The US population structure in the next 10 years may be a low-profile version of the 90s. Although the aging trend in the US cannot be reversed, according to the OECD estimates, the growth rate of the US pan-labor force population aged 20-64 will enter a recovery period in 2023 and continue until 2041. Furthermore, the growth rate of the US population in the 20-49 home-buying age group was also picking up in 2017-2026.
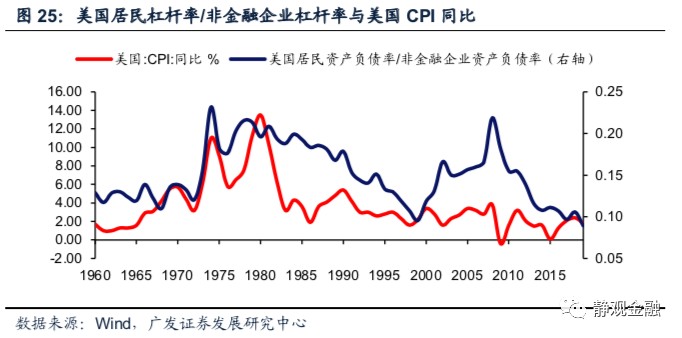
Furthermore, after the impact of the public health incident, the three US departments may have experienced a shift in leverage ratios, and the inflation centers have now moved upward during the stages of residents increasing leverage and companies lowering leverage. The size of US debt as a share of GDP reached 106.2% in 2019. Under the impact of public health events, this indicator may rise to 130%-140% this year and next two years. The US will also be in a high debt and low interest rate environment within a few years after the public health incident ends, similar to the late 40s to the early 50s of the last century. The balance ratio of the US non-financial corporate sector continued to rise after the financial crisis. The balance ratio of US non-financial enterprises in 2019 was 138%, slightly lower than 142% in 1999, the second highest level since data were available. The residential sector continued to deleverage after the financial crisis: the balance ratio of US residents was 18.9% in 2008, and the indicator fell to 12.3% in 2019, the lowest level in 35 years. Overall, the current level of leverage in the US private sector is similar to that of the late 90s of the last century. After the public health incident is over, the corporate sector may enter the stage of reducing leverage, while the residential sector is expected to enter a cycle of increasing leverage. Combined with the assessment of population factors, real estate is expected to become the long-term driving force of the US economy after the public health incident. As shown in Figure 25, the inflation centers are now moving upward during the period when US residents increase leverage and companies reduce leverage.
(3) The social structure may be reversed in the next 10 years
There is a huge contrast between America's two party governing philosophies. The Democratic Party promotes social fairness, and the Republican Party advocates the pursuit of efficiency. The two parties have achieved their governing philosophy through fiscal and taxation policies. The Democratic Party is good at raising taxes, but “robs the rich and helps the poor,” and the Republican Party pushes for tax cuts and capital to seek profit. After World War I, the US re-chose “fairness” and “efficiency” twice, which occurred after the Great Depression and in 1980, respectively. In the Great Depression era, the polarization between the rich and the poor in the US was extremely serious, and the share of the middle class was extremely low. After that, American society entered a stage where the concept of “fairness” dominated, and the political influence of the Democratic Party increased. When economic stagnation in the 70s was combined with significant improvements in the structure of American society, American society once again yearned for “efficiency.” With the election of Republican Ronald Reagan as President of the United States in 1980 as a landmark event, American society has once again entered a stage dominated by “efficiency”, and the influence of the Republican Party in politics has increased. Since then, the share of the middle class in the US began to decline, and the degree of polarization between rich and poor has intensified again. Currently, the share of the middle class in the US is below 50%.
As can be seen when the influence of the two parties alternated in power, American society's choices about “fairness” and “efficiency” depended on the social structure itself. The current degree of differentiation between rich and poor in the US is comparable to that of the Great Depression. This factor is likely to make the US election within this year or 2024 a critical time point for reversing the structure of American society. Once the US welcomes a Democratic president again, it is likely that it will enter a tax increase cycle, and the share of the US middle class is also expected to rise again. At that time, the spending power of the US residential sector will also gradually increase.
Risk warning
(1) Public health events in the US have exceeded expectations
(2) US monetary policy exceeds expectations
(3) Changes in the US population structure have exceeded expectations
(4) The results of the US election exceeded expectations
