Key points of investment
Under policy support, the photovoltaic industry has shown cyclical fluctuations and rises.When the cost of power generation in the photovoltaic industry is higher than the social average electricity price, the economy of the photovoltaic industry mainly depends on the subsidy policy. The adjustment of the subsidy policy is an important driving force for cyclical fluctuations in PV installations. Looking back at the two cycles of the photovoltaic industry from 2010 to 2014, the rush wave caused by the decline in European subsidy policies, and 2014-2019 was the cyclical fluctuation in the installed growth rate brought about by domestic subsidy policy adjustments. When the photovoltaic industry fails to achieve economic viability independently, the cyclical characteristics of the industry are remarkable.
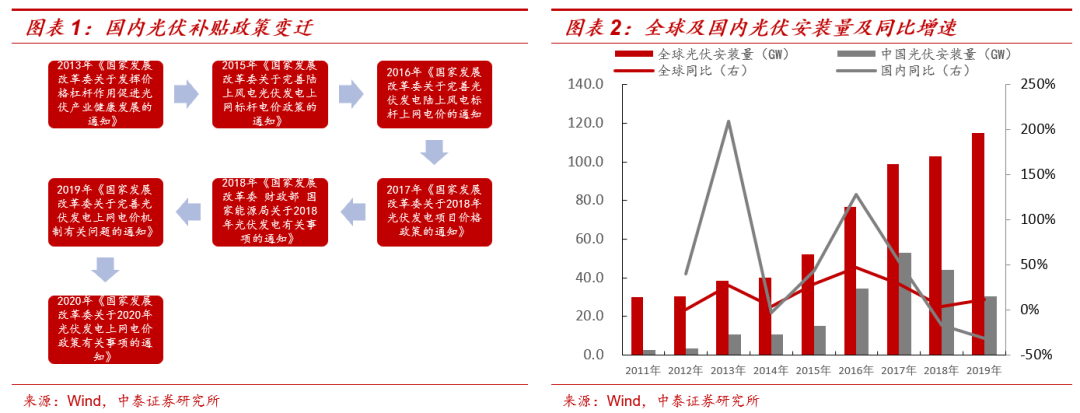
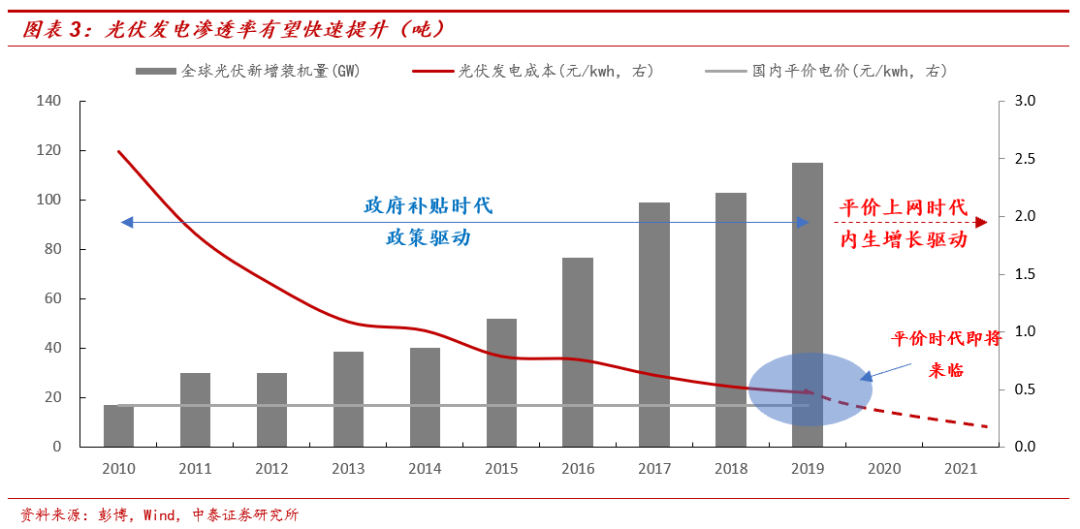
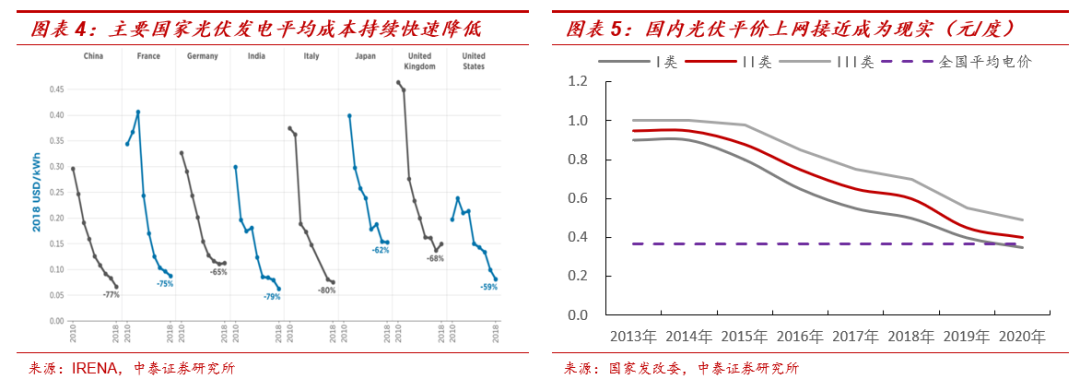
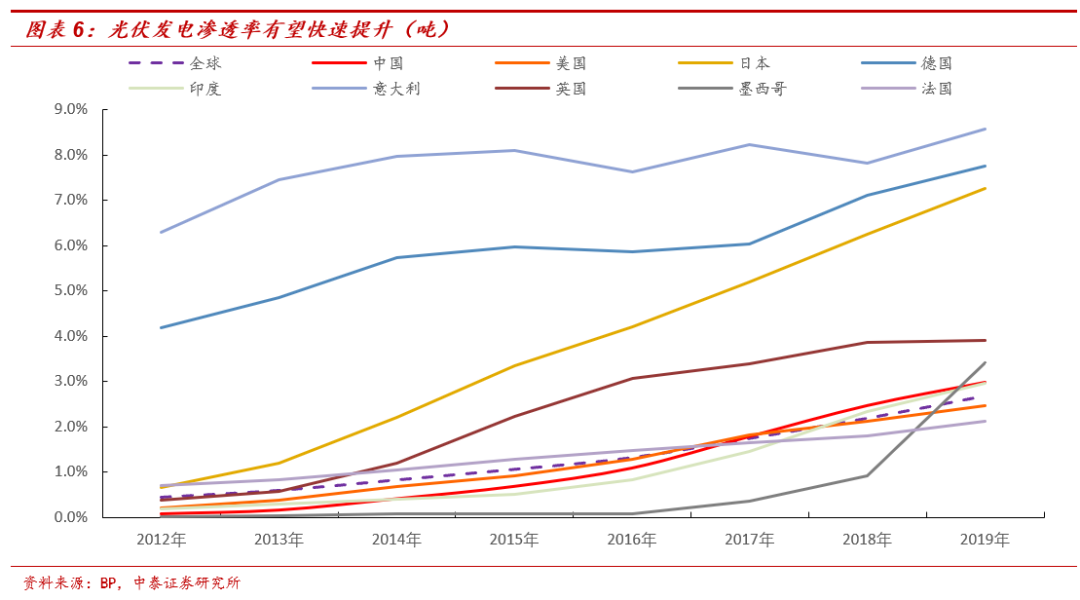
 As the cost of the photovoltaic industry continues to decline, the era of affordable Internet access is approaching, and the industry is expected to start a high increase driven by endogenics. In the past ten years, along with policy subsidies, the photovoltaic industry's own cost reduction effect has been obvious. This shows that silicon and non-silicon costs have continued to decrease, and battery efficiency has continued to improve. Taking China as an example, the cost per unit of photovoltaic power generation in 2018 was reduced by 77% compared to 2010. The cost of electricity consumption is already close to the average power generation cost of domestic thermal power, and affordable Internet access is close to reality in some regions. By the end of 2019, the world's cumulative installed capacity exceeded 600 GW. Among them, 116 GW was added last year, a record of 116 GW was added. -In 2019, the average annual compound growth rate of global photovoltaic installations reached 18.29%, but the current penetration rate of photovoltaic power generation is still low. In 2019, global photovoltaic power generation accounted for only 2.7%, and domestic consumption accounted for 3%. With the advent of the affordable era and the further reduction in the cost of photovoltaic power generation, the penetration rate of photovoltaic power generation will also increase further, and there is broad room for growth in the future.
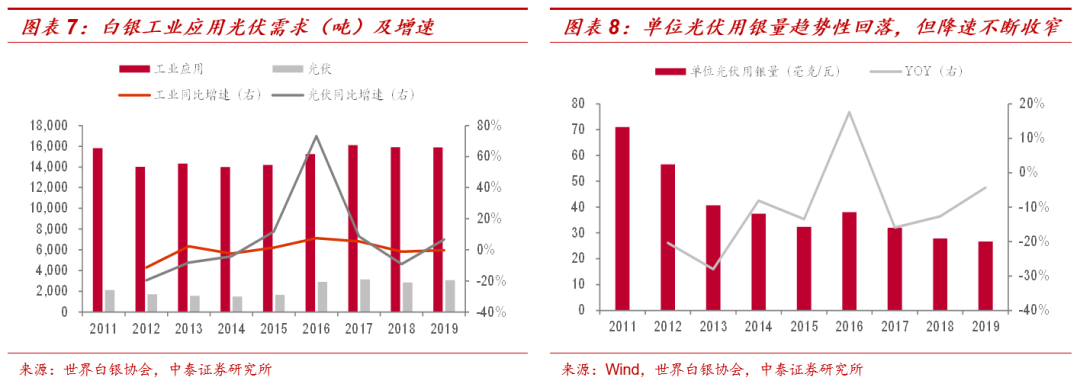
The amount of silver used per unit of photovoltaics continues to decline, but the deceleration has clearly slowed.The application of silver in the photovoltaic industry is mainly silver and silver in cells. The compound growth rate of silver used in photovoltaics was 15% in 2011-2019, and the demand for silver in photovoltaic applications reached 3,069 tons (9.87 million ounces) in 2019, accounting for 10% of the total demand for silver.However, due to the relatively high cost of silver, the photovoltaic industry has always been committed to saving the use of silver through improvements in process technologyIn 2011-2019, the amount of silver used per unit of photovoltaic power generation decreased by 11.5% per year. In 2019, the amount of silver used per unit of photovoltaic fell to 26.72 mg/W, but we found that the deceleration rate of silver used per unit of photovoltaic power generation continued to decline. On the one hand, silver, as the most conductive metal, was irreplaceable for maintaining or improving the performance of photovoltaic cells to a certain extent. On the other hand, with the advent of the era of affordability of photovoltaic power generation, the incentive to further reduce the amount of silver used to control costs continued to decline.
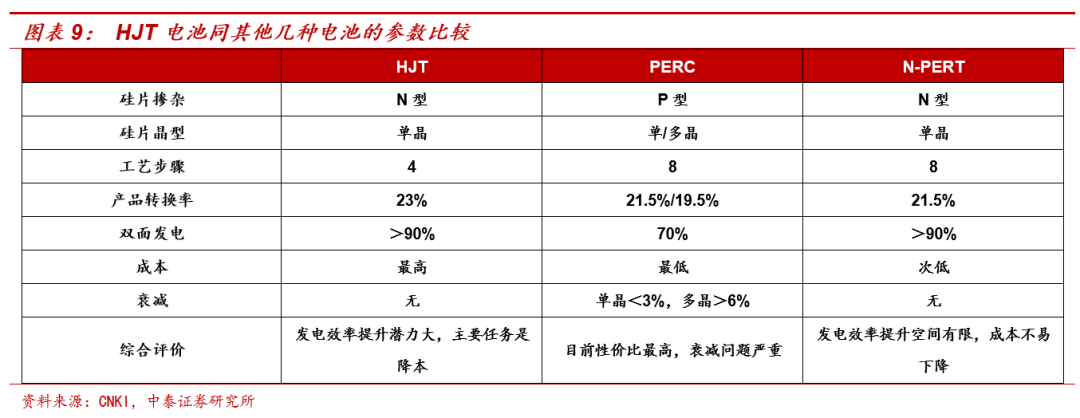
The increase in HJT penetration rate supports the amount of silver used per unit of photovoltaics.Before 2015, aluminum backfield (BSF) batteries dominated silicon-based solar cells, with a conversion efficiency of 19%, and PERC began in 2015. Currently, PERC batteries have become mainstream batteries in the market, with a conversion efficiency of 21.5%. The current efficiency of PERC batteries is close to the ceiling, while HJT batteries have higher potential conversion efficiency (theoretical conversion efficiency is above 27%). With methods such as the thinning of silicon wafers, increased equipment capacity utilization and reduced slurry usage, the cost of HJT batteries will be further reduced in the future, while HJT has higher conversion efficiency and simplified conversion efficiency Under advantages such as process flow and high double-sided power generation rate, the focus of the development of the photovoltaic battery industry will also shift from PERC batteries to HJT batteries, and the amount of silver used per unit of HJT batteries is about 2.6 times that of mainstream PERC batteries. The increase in HJT penetration rate supports the silver consumption per unit of photovoltaic cells.
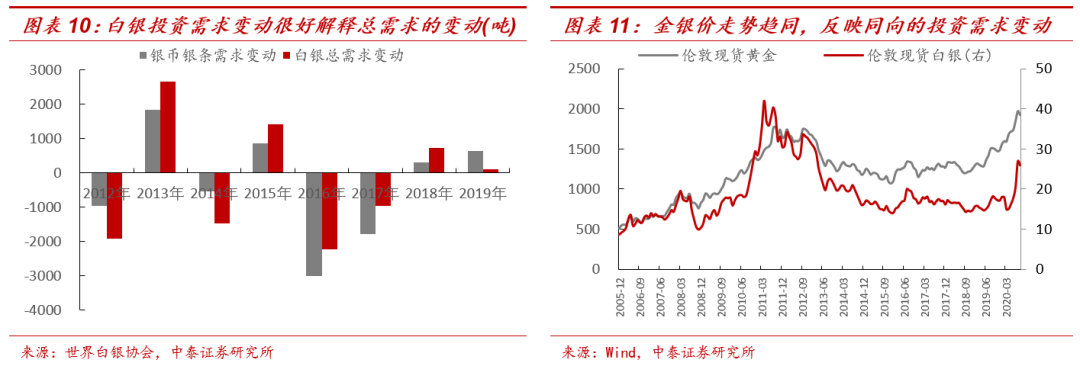
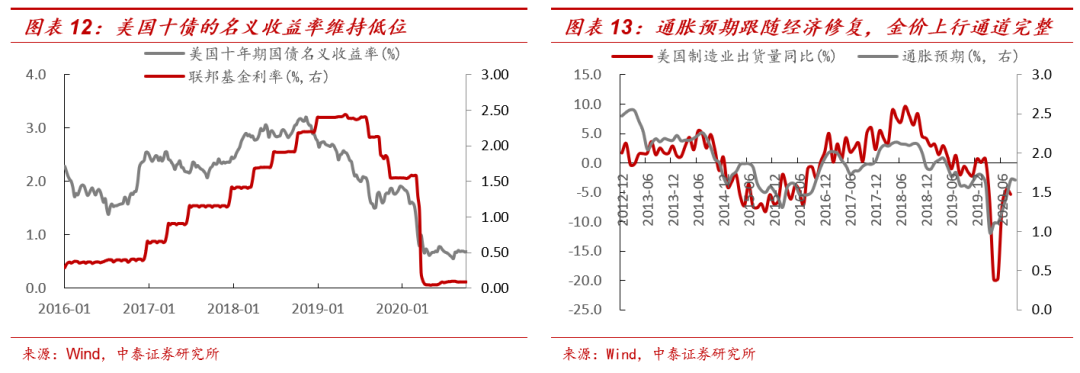
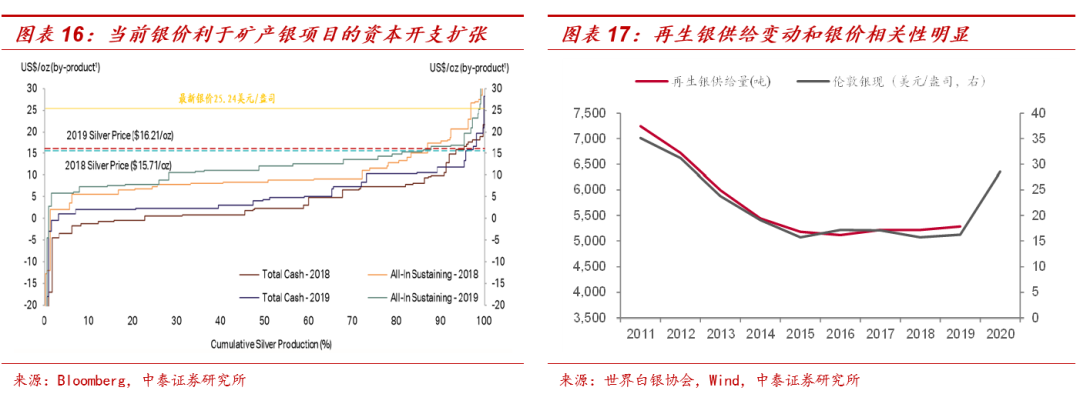
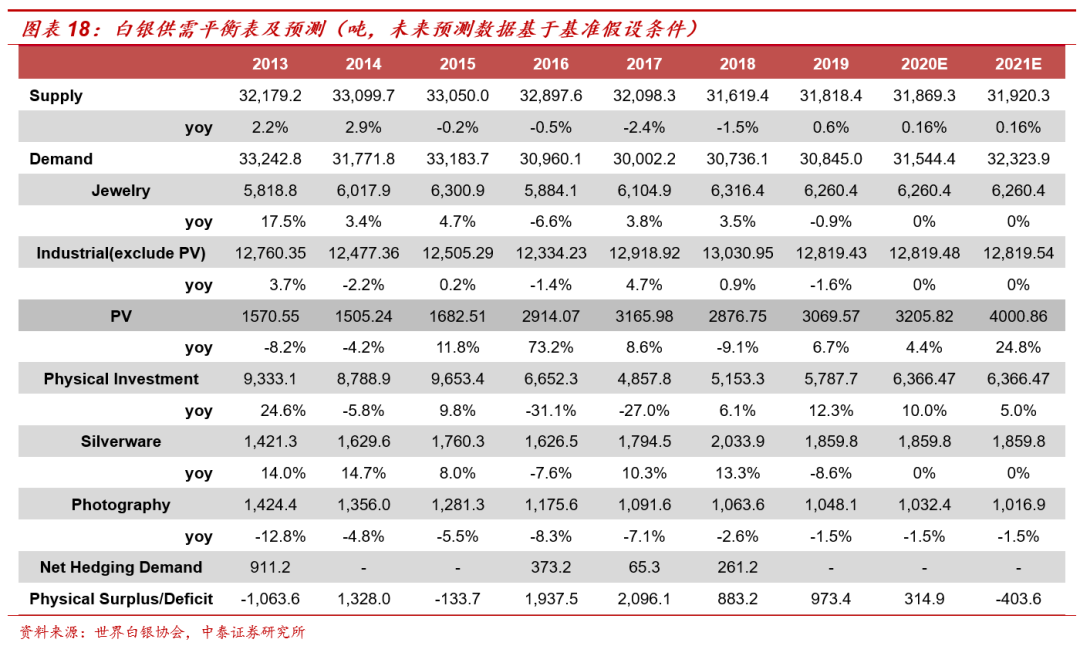
Investment demand will continue to support the overall demand for silver.Historically, silver investment demand is the core variable driving changes in the total demand for silver. In 2011-2013, the average demand for physical silver was 8,427 tons, while the 2014-2019 average fell to 6,816 tons, a decrease of 1,611 tons. The overall balance between silver supply and demand also changed from an average shortage of 426 tons in 2011-2013 to an average surplus of 1,181 tons in 2014-2019. Changes in physical silver investment demand can easily explain changes in the relationship between silver supply and demand. Similar to gold, investment demand also drives changes in silver prices Core variables. Under the impact of the public health incident, the US economy is still on a recovery path. The Fed's loose monetary policy will continue to be maintained. Remote interest rates are easy to fall and difficult to rise, while inflation expectations follow the gradual upward trend in the economy, and real interest rates will continue to remain low. Corresponding investment demand for silver will still support aggregate demand.
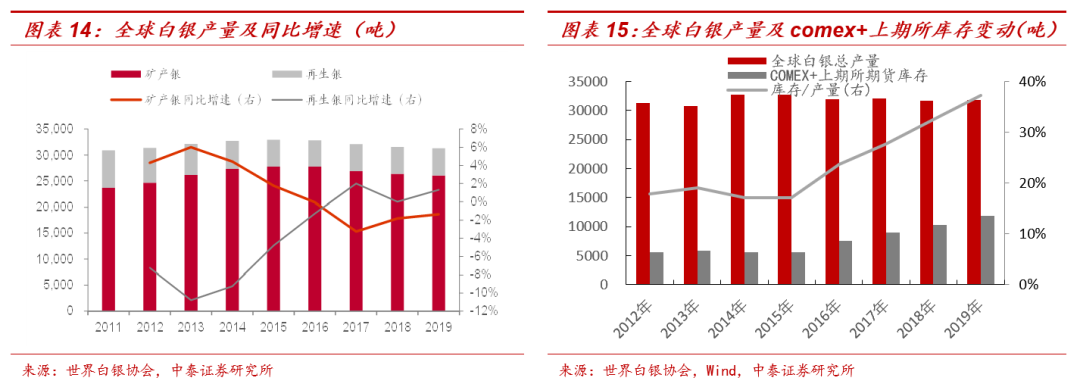
On the supply side, the supply of mineral silver and recycled silver is expected to pick up, but no major capital expenditure items have been discovered.The supply of silver mainly includes mineral silver, recycled silver, official silver sales, etc. The total supply of silver in 2019 was about 31,800 tons, of which 26,000 tons of mineral silver were supplied, accounting for 81.8%, and the supply of recycled silver was 503,000 tons, accounting for 16.7%. These two formed the main part of the silver supply. The production form of mineral silver is mainly produced in the form of companion ore and independent silver ore. More than two-thirds of these are associated ore forms, and are mostly associated with the four metals lead, zinc, copper, and gold. The annual compound growth rate of global mineral silver in 2011-2019 was 1.2%, the annual compound growth rate of recycled silver was -3.87%, and the annual compound growth rate of total silver supply was only 0.16%. As silver prices pick up, both mineral silver and recycled silver production are expected to rise. From an inventory perspective, Comex+ had an inventory of 11,800 tons of silver futures in the first half of 2019, accounting for 37.23% of the total supply for the full year of 2019.
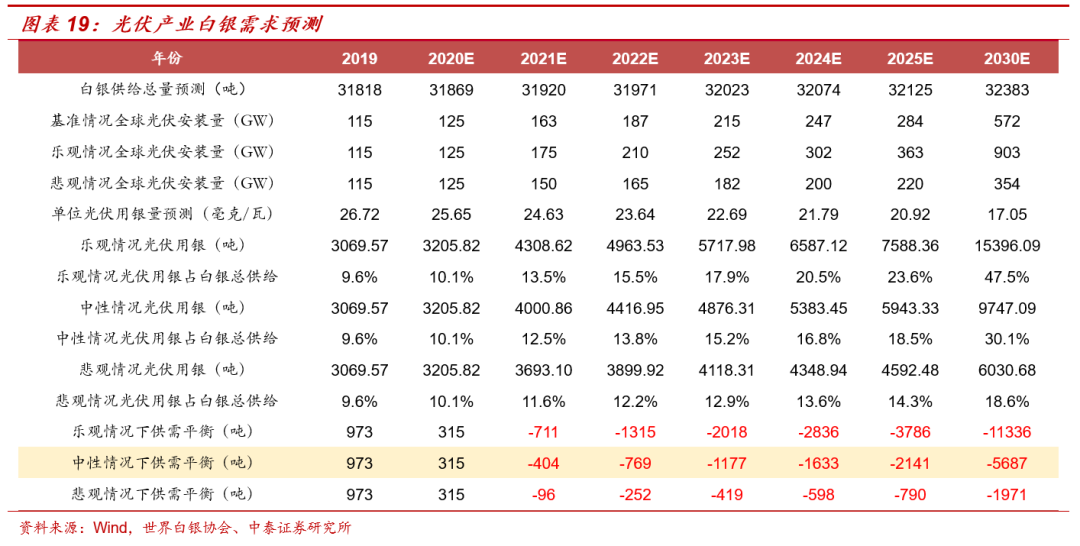
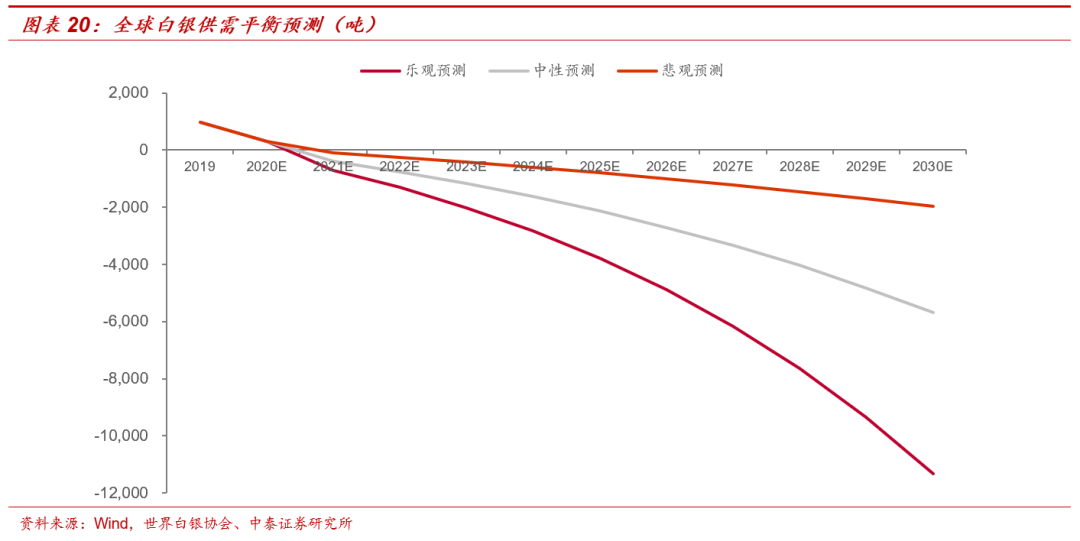
Investment demand remains stable, and the continued increase in silver used in photovoltaics will cause the relationship between silver supply and demand to continue to tighten.Assuming that the amount of silver used per unit of PV in the future decreases by an average of 4% per year, and the global PV installed capacity in 2020 is 125GW, the following assumptions are made for the annual growth rate of PV installed capacity:
Under the benchmark assumption, the growth rate in '21 was 30%, and the annualized compound growth rate was 15% thereafter
Under optimistic assumptions, the growth rate in '21 was 40%, and the annualized compound growth rate was 20% thereafter
Under pessimistic assumptions, the growth rate in '21 was 20%, and the annualized compound growth rate was 10% thereafter
Demand for silver investment increased due to a decline in real interest rates. Other silver demand was assumed according to the supply-demand balance sheet; on the supply side, assuming that production of mineral silver and recycled silver recovered, the compound annual growth rate of total supply recovered to 0.16%.According to estimates, under the optimistic assumption, the supply of silver in 2021 changed from excess to a shortage of 711 tons (accounting for 2.23% of the total supply for that year), under the neutral assumption, the supply of silver in 2021 changed to a shortage of 404 tons (accounting for 1.27% of the total supply for that year), and under the pessimistic assumption, the supply of silver in 2021 changed to a shortage of 96 tons (accounting for 0.3% of the total supply for that year).
Risk warning: Risk of macroeconomic fluctuations, risk of overseas public health events getting out of control, risk of policy uncertainty, risk of inventory pressure, etc.

 随着光伏行业成本的不断下降,平价上网时代已临近,行业有望开启内生驱动下的高增。在过去十年,伴随着政策补贴,光伏行业自身成本降低效果明显,表现为硅料、非硅成本持续降低,电池效率不断提升,以国内为例,2018年单位光伏发电量对应的成本相比2010年降低77%,度电成本已靠近国内火电的平均发电成本,平价上网在部分地区已接近现实,光伏电池目前已经成为可再生能源领域的主要选择,截至2019年底,全球累计装机容量超过600GW,其中去年新增116GW创纪录,2011-2019年全球光伏安装量年均复合增速达18.29%,但目前光伏发电的渗透率仍然较低,2019年全球光伏发电量占比仅2.7%,国内占比3%,随着平价时代到来以及光伏发电成本的进一步降低,光伏发电的渗透率也将进一步提升,未来具备广阔成长空间。