Is Powermatic Data Systems Limited's (SGX:BCY) Stock's Recent Performance A Reflection Of Its Financial Health?
Powermatic Data Systems' (SGX:BCY) stock is up by 6.6% over the past three months. Given that the market rewards strong financials in the long-term, we wonder if that is the case in this instance. Specifically, we decided to study Powermatic Data Systems' ROE in this article.
Return on equity or ROE is an important factor to be considered by a shareholder because it tells them how effectively their capital is being reinvested. In other words, it is a profitability ratio which measures the rate of return on the capital provided by the company's shareholders.
Check out our latest analysis for Powermatic Data Systems
How Is ROE Calculated?
The formula for ROE is:
Return on Equity = Net Profit (from continuing operations) ÷ Shareholders' Equity
So, based on the above formula, the ROE for Powermatic Data Systems is:
13% = S$9.5m ÷ S$74m (Based on the trailing twelve months to March 2023).
The 'return' is the amount earned after tax over the last twelve months. One way to conceptualize this is that for each SGD1 of shareholders' capital it has, the company made SGD0.13 in profit.
What Is The Relationship Between ROE And Earnings Growth?
So far, we've learned that ROE is a measure of a company's profitability. We now need to evaluate how much profit the company reinvests or "retains" for future growth which then gives us an idea about the growth potential of the company. Assuming all else is equal, companies that have both a higher return on equity and higher profit retention are usually the ones that have a higher growth rate when compared to companies that don't have the same features.
Powermatic Data Systems' Earnings Growth And 13% ROE
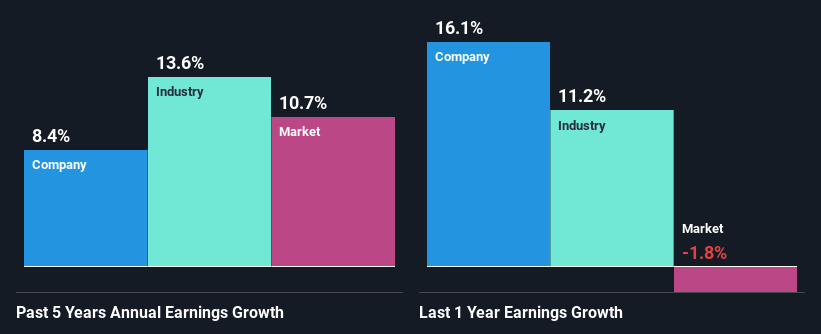
At first glance, Powermatic Data Systems seems to have a decent ROE. On comparing with the average industry ROE of 7.8% the company's ROE looks pretty remarkable. This probably laid the ground for Powermatic Data Systems' moderate 8.4% net income growth seen over the past five years.
Next, on comparing with the industry net income growth, we found that Powermatic Data Systems' reported growth was lower than the industry growth of 14% over the last few years, which is not something we like to see.
Earnings growth is a huge factor in stock valuation. It’s important for an investor to know whether the market has priced in the company's expected earnings growth (or decline). Doing so will help them establish if the stock's future looks promising or ominous. Is Powermatic Data Systems fairly valued compared to other companies? These 3 valuation measures might help you decide.
Is Powermatic Data Systems Efficiently Re-investing Its Profits?
Powermatic Data Systems has a healthy combination of a moderate three-year median payout ratio of 27% (or a retention ratio of 73%) and a respectable amount of growth in earnings as we saw above, meaning that the company has been making efficient use of its profits.
Moreover, Powermatic Data Systems is determined to keep sharing its profits with shareholders which we infer from its long history of paying a dividend for at least ten years.
Conclusion
Overall, we are quite pleased with Powermatic Data Systems' performance. Particularly, we like that the company is reinvesting heavily into its business, and at a high rate of return. As a result, the decent growth in its earnings is not surprising. If the company continues to grow its earnings the way it has, that could have a positive impact on its share price given how earnings per share influence long-term share prices. Not to forget, share price outcomes are also dependent on the potential risks a company may face. So it is important for investors to be aware of the risks involved in the business. To know the 2 risks we have identified for Powermatic Data Systems visit our risks dashboard for free.
Have feedback on this article? Concerned about the content? Get in touch with us directly. Alternatively, email editorial-team (at) simplywallst.com.
This article by Simply Wall St is general in nature. We provide commentary based on historical data and analyst forecasts only using an unbiased methodology and our articles are not intended to be financial advice. It does not constitute a recommendation to buy or sell any stock, and does not take account of your objectives, or your financial situation. We aim to bring you long-term focused analysis driven by fundamental data. Note that our analysis may not factor in the latest price-sensitive company announcements or qualitative material. Simply Wall St has no position in any stocks mentioned.
Join A Paid User Research Session
You’ll receive a US$30 Amazon Gift card for 1 hour of your time while helping us build better investing tools for the individual investors like yourself. Sign up here
