
 Yahoo Finance
 Investors Met With Slowing Returns on Capital At Heineken Holding (AMS:HEIO)
What are the early trends we should look for to identify a stock that could multiply in value over the long term? Firstly, we'd want to identify a growing return on capital employed (ROCE) and then alongside that, an ever-increasing base of capital employed. This shows us that it's a compounding machine, able to continually reinvest its earnings back into the business and generate higher returns. However, after investigating Heineken Holding (AMS:HEIO), we don't think it's current trends fit the mold of a multi-bagger.
Understanding Return On Capital Employed (ROCE)
For those who don't know, ROCE is a measure of a company's yearly pre-tax profit (its return), relative to the capital employed in the business. To calculate this metric for Heineken Holding, this is the formula:
Return on Capital Employed = Earnings Before Interest and Tax (EBIT) ÷ (Total Assets - Current Liabilities)
0.10 = €3.8b ÷ (€52b - €14b) (Based on the trailing twelve months to December 2022).
Therefore, Heineken Holding has an ROCE of 10.0%. On its own that's a low return on capital but it's in line with the industry's average returns of 9.6%.
See our latest analysis for Heineken Holding
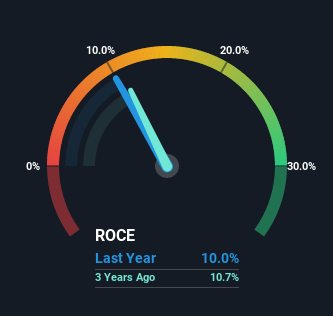
Historical performance is a great place to start when researching a stock so above you can see the gauge for Heineken Holding's ROCE against it's prior returns. If you want to delve into the historical earnings, revenue and cash flow of Heineken Holding, check out these free graphs here.
How Are Returns Trending?
The returns on capital haven't changed much for Heineken Holding in recent years. The company has consistently earned 10.0% for the last five years, and the capital employed within the business has risen 25% in that time. This poor ROCE doesn't inspire confidence right now, and with the increase in capital employed, it's evident that the business isn't deploying the funds into high return investments.
In Conclusion...
In summary, Heineken Holding has simply been reinvesting capital and generating the same low rate of return as before. And investors may be recognizing these trends since the stock has only returned a total of 3.0% to shareholders over the last five years. So if you're looking for a multi-bagger, the underlying trends indicate you may have better chances elsewhere.
If you'd like to know about the risks facing Heineken Holding, we've discovered 2 warning signs that you should be aware of.
If you want to search for solid companies with great earnings, check out this free list of companies with good balance sheets and impressive returns on equity.
Have feedback on this article? Concerned about the content? Get in touch with us directly. Alternatively, email editorial-team (at) simplywallst.com.
This article by Simply Wall St is general in nature. We provide commentary based on historical data and analyst forecasts only using an unbiased methodology and our articles are not intended to be financial advice. It does not constitute a recommendation to buy or sell any stock, and does not take account of your objectives, or your financial situation. We aim to bring you long-term focused analysis driven by fundamental data. Note that our analysis may not factor in the latest price-sensitive company announcements or qualitative material. Simply Wall St has no position in any stocks mentioned.
Join A Paid User Research Session
You’ll receive a US$30 Amazon Gift card for 1 hour of your time while helping us build better investing tools for the individual investors like yourself. Sign up here
