
One simple way to benefit from the stock market is to buy an index fund. But if you pick the right individual stocks, you could make more than that. For example, the Sinoma Energy Conservation Ltd. (SHSE:603126) share price is up 93% in the last three years, clearly besting the market return of around 12% (not including dividends). However, more recent returns haven't been as impressive as that, with the stock returning just 19% in the last year , including dividends .
Although Sinoma Energy Conservation has shed CN¥372m from its market cap this week, let's take a look at its longer term fundamental trends and see if they've driven returns.
Check out our latest analysis for Sinoma Energy Conservation
To quote Buffett, 'Ships will sail around the world but the Flat Earth Society will flourish. There will continue to be wide discrepancies between price and value in the marketplace...' One flawed but reasonable way to assess how sentiment around a company has changed is to compare the earnings per share (EPS) with the share price.
Sinoma Energy Conservation was able to grow its EPS at 13% per year over three years, sending the share price higher. In comparison, the 25% per year gain in the share price outpaces the EPS growth. This suggests that, as the business progressed over the last few years, it gained the confidence of market participants. It's not unusual to see the market 're-rate' a stock, after a few years of growth.
You can see how EPS has changed over time in the image below (click on the chart to see the exact values).
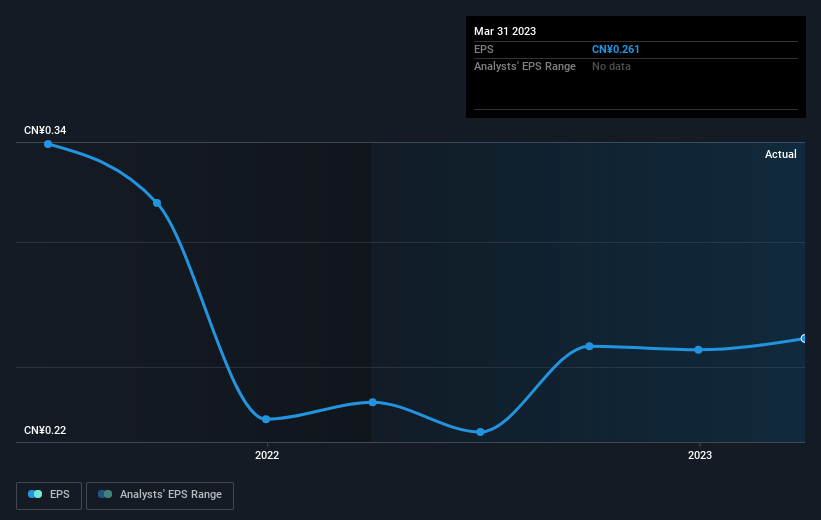
Dive deeper into Sinoma Energy Conservation's key metrics by checking this interactive graph of Sinoma Energy Conservation's earnings, revenue and cash flow.
What About Dividends?
It is important to consider the total shareholder return, as well as the share price return, for any given stock. The TSR is a return calculation that accounts for the value of cash dividends (assuming that any dividend received was reinvested) and the calculated value of any discounted capital raisings and spin-offs. So for companies that pay a generous dividend, the TSR is often a lot higher than the share price return. As it happens, Sinoma Energy Conservation's TSR for the last 3 years was 101%, which exceeds the share price return mentioned earlier. This is largely a result of its dividend payments!
A Different Perspective
We're pleased to report that Sinoma Energy Conservation shareholders have received a total shareholder return of 19% over one year. And that does include the dividend. Since the one-year TSR is better than the five-year TSR (the latter coming in at 2% per year), it would seem that the stock's performance has improved in recent times. In the best case scenario, this may hint at some real business momentum, implying that now could be a great time to delve deeper. It's always interesting to track share price performance over the longer term. But to understand Sinoma Energy Conservation better, we need to consider many other factors. Even so, be aware that Sinoma Energy Conservation is showing 2 warning signs in our investment analysis , you should know about...
If you are like me, then you will not want to miss this free list of growing companies that insiders are buying.
Please note, the market returns quoted in this article reflect the market weighted average returns of stocks that currently trade on Chinese exchanges.
Have feedback on this article? Concerned about the content? Get in touch with us directly. Alternatively, email editorial-team (at) simplywallst.com.
This article by Simply Wall St is general in nature. We provide commentary based on historical data and analyst forecasts only using an unbiased methodology and our articles are not intended to be financial advice. It does not constitute a recommendation to buy or sell any stock, and does not take account of your objectives, or your financial situation. We aim to bring you long-term focused analysis driven by fundamental data. Note that our analysis may not factor in the latest price-sensitive company announcements or qualitative material. Simply Wall St has no position in any stocks mentioned.