
The graph shows the actual or expected sequential revenue growth from the 4th quarter of 2022 to the first quarter of 2023 for sixteen of the top MSOs. Eight of the sixteen companies have already announced Q1:23 results; these companies have an "A" after their ticker symbol. The sequential revenue growths for the eight companies that have not yet reported are calculated based on consensus estimates of Q1:23 revenues compared to actual Q4: 22 revenues.
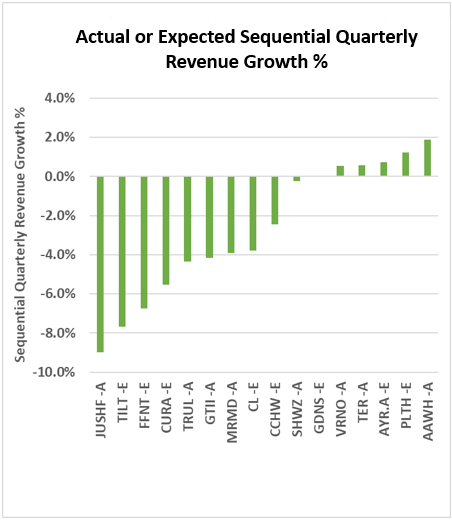
A significant part of Q1's revenue declines are attributable to seasonality. The 4th quarter tends to be stronger than the first in most markets except Florida. The group is projected to have an...
Login or create a forever free account to read this news
Sign up/Log in