
 Yahoo Finance
 KTMG (Catalist:XCF) Might Be Having Difficulty Using Its Capital Effectively
Finding a business that has the potential to grow substantially is not easy, but it is possible if we look at a few key financial metrics. Firstly, we'd want to identify a growing return on capital employed (ROCE) and then alongside that, an ever-increasing base of capital employed. Put simply, these types of businesses are compounding machines, meaning they are continually reinvesting their earnings at ever-higher rates of return. Although, when we looked at KTMG (Catalist:XCF), it didn't seem to tick all of these boxes.
What Is Return On Capital Employed (ROCE)?
If you haven't worked with ROCE before, it measures the 'return' (pre-tax profit) a company generates from capital employed in its business. Analysts use this formula to calculate it for KTMG:
Return on Capital Employed = Earnings Before Interest and Tax (EBIT) ÷ (Total Assets - Current Liabilities)
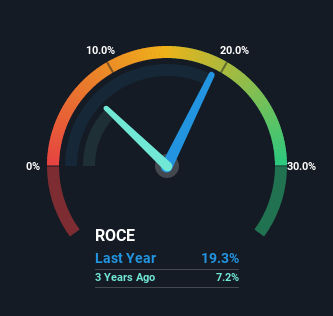
0.19 = S$4.7m ÷ (S$51m - S$26m) (Based on the trailing twelve months to December 2022).
Therefore, KTMG has an ROCE of 19%. On its own, that's a standard return, however it's much better than the 10% generated by the Luxury industry.
Check out our latest analysis for KTMG
While the past is not representative of the future, it can be helpful to know how a company has performed historically, which is why we have this chart above. If you're interested in investigating KTMG's past further, check out this free graph of past earnings, revenue and cash flow.
So How Is KTMG's ROCE Trending?
When we looked at the ROCE trend at KTMG, we didn't gain much confidence. Over the last five years, returns on capital have decreased to 19% from 25% five years ago. However it looks like KTMG might be reinvesting for long term growth because while capital employed has increased, the company's sales haven't changed much in the last 12 months. It's worth keeping an eye on the company's earnings from here on to see if these investments do end up contributing to the bottom line.
On a related note, KTMG has decreased its current liabilities to 52% of total assets. So we could link some of this to the decrease in ROCE. Effectively this means their suppliers or short-term creditors are funding less of the business, which reduces some elements of risk. Since the business is basically funding more of its operations with it's own money, you could argue this has made the business less efficient at generating ROCE. Either way, they're still at a pretty high level, so we'd like to see them fall further if possible.
The Bottom Line
To conclude, we've found that KTMG is reinvesting in the business, but returns have been falling. Since the stock has gained an impressive 33% over the last three years, investors must think there's better things to come. But if the trajectory of these underlying trends continue, we think the likelihood of it being a multi-bagger from here isn't high.
If you want to know some of the risks facing KTMG we've found 2 warning signs (1 is concerning!) that you should be aware of before investing here.
While KTMG may not currently earn the highest returns, we've compiled a list of companies that currently earn more than 25% return on equity. Check out this free list here.
Have feedback on this article? Concerned about the content? Get in touch with us directly. Alternatively, email editorial-team (at) simplywallst.com.
This article by Simply Wall St is general in nature. We provide commentary based on historical data and analyst forecasts only using an unbiased methodology and our articles are not intended to be financial advice. It does not constitute a recommendation to buy or sell any stock, and does not take account of your objectives, or your financial situation. We aim to bring you long-term focused analysis driven by fundamental data. Note that our analysis may not factor in the latest price-sensitive company announcements or qualitative material. Simply Wall St has no position in any stocks mentioned.
Join A Paid User Research Session
You’ll receive a US$30 Amazon Gift card for 1 hour of your time while helping us build better investing tools for the individual investors like yourself. Sign up here
