
 摘要
摘要Author:Liang Zhonghua and Wu Jialu
Source: Li Xunlei Finance and Investment
Population is the key factor of economic growth, and the change of population flow will also affect the development of regional economy. In the last population topic, "Baby Boom" is no longer, "Bachelors" is coming-- five major trends of China's population in the next 30 years, we predict the evolution trend of China's population from the time dimension, while in this article, we will proceed from the regional dimension. Observe the recent new changes in the geographical flow of population. Which cities are flowing in and which are flowing out? The floating population has declined for four consecutive years. Is it true that the population has generally returned to their hometown? Let's take an inventory of the panoramic picture of population migration across the country in 2018.
 Abstract
1The general direction of flow: moving eastward and southward, concentrating to the core.In 2018, 7 of the 10 provinces and cities in eastern China were net inflow areas, and the net inflow population of southern provinces was as high as 1.685 million. From the perspective of provinces, Guangdong, Zhejiang and Anhui have the largest net population inflow, while Beijing ranks first in the country. From the point of view of the situation in the province, it is very obvious to concentrate to the provincial capital and "Gemini" and other core cities.
2What drives the flow? First look at the economy, and second look at the policy.The driving factors behind population mobility are economic factors such as income gap, and population management policy. Beijing and Shanghai are "controlling people", while Anhui and Xi'an are robbing people on a large scale, and the effect is very obvious.
3The development of urban agglomeration: where is the outflow of population from Beijing?The four major urban agglomerations in China show an obvious new pattern of "three strong and one weak". There is a substantial net outflow of population from Beijing, Tianjin and Hebei, and the outflow from Beijing has not gone to Tianjin and Hebei; the Yangtze River Delta is still in a substantial net inflow, with Zhejiang taking the lead, Anhui has become the biggest "dark horse" due to the policy of robbing people, while Jiangsu has a certain impact; the concentration of population in the Pearl River Delta region to the "Little Pearl River Delta" is very obvious; the population of the Chengdu-Chongqing urban agglomeration is more mobile to the "Twin Stars" with Chengdu and Chongqing as the center.
4There is a general net outflow from the small town, who will be the next "Hegang"?In terms of urban hierarchy, the population is mainly concentrated in the new first-tier cities, while 70% of the fourth-and fifth-tier cities are facing net population outflow. However, the real estate market in small cities in China has risen sharply in the past few years, which will face risks such as net population outflow and small second-hand housing market in the long run. In the context of the policy of the city, the "robbing war" will become more and more intense, and the "cabbage price" real estate in Hegang City may not be alone in the long run.
1
General direction of flow:Move eastward and southward and concentrate to the core
The change of resident population can be divided into two parts, one comes from the natural growth of population, the other is the migration of stock population between regions. Therefore, after excluding the natural growth of the population from the total changes in the resident population, we can get the situation of net population movement between regions.
From the national level, one of the most obvious characteristics of population mobility in China is "moving eastward".According to our estimates, the eastern part of China continues to show a net population inflow, and the total population inflow has reached 7.42 million since 2011. In 2018, the eastern region continued this trend, with a net population inflow of 993000, and 7 of the 10 eastern provinces and cities were net population inflow areas, with obvious advantages compared with the central and western provinces.
Chart:Trend of net population inflow by region (10,000)
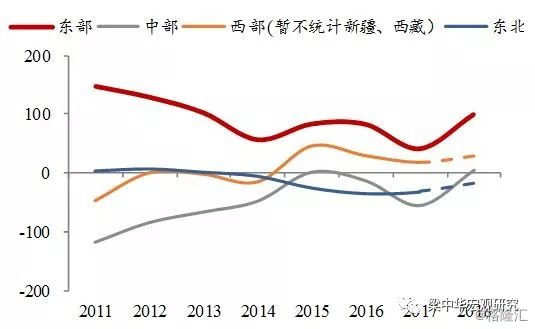
Source:Local Statistical Bulletin, WIND, China-Thailand Securities Research Institute
注:The data of Jilin, Tibet, Yunnan and Ningxia are missing, the same below.
Another major feature of population mobility is "going south".If the northern and southern provinces of China are roughly divided according to the Qinling-Huaihe River, the net population inflow areas are basically distributed in the south, and the net inflow population of the southern provinces (except Yunnan) is as high as 1.685 million in 2018.
Chart:Distribution of population mobility in southern and northern provinces and cities (10,000 people)
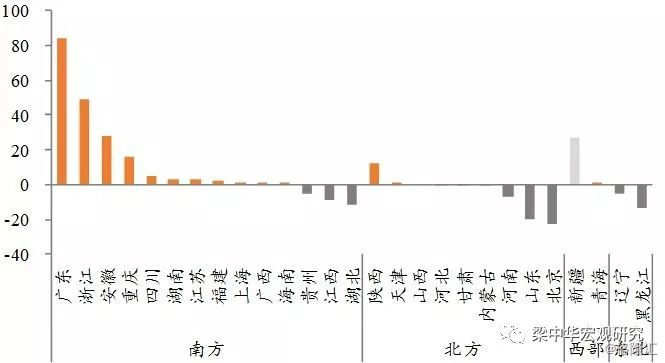
Source: local Statistical Bulletin, WIND, China-Thailand Securities Research Institute
From the perspective of specific provinces, Guangdong, Zhejiang and Anhui have the largest net population inflow, while Beijing and Shandong have the most serious net population outflow.In 2018, Guangdong's net population inflow exceeded 800000, Zhejiang nearly 500000, and Anhui nearly 300000, with the largest population inflow. In 2018, Beijing has a net population outflow of 220000, which is the largest in China, and the negative increase of resident population in Beijing is also the first in the country, followed by Shandong and Heilongjiang, and the net population outflow is also more serious.
Chart:Distribution of population mobility in southern and northern provinces and cities (10,000 people)

Source: local Statistical Bulletin, WIND, China-Thailand Securities Research Institute
From the perspective of population mobility in the province, it is a general trend to concentrate on the core cities.Judging from the data of the 2010 census and the 2015 sample survey, the inter-provincial floating population actually accounts for only about 1x3, more of which is the movement of people within the province. According to our estimates, the concentration of resident population to provincial capitals or economically strong cities in 2018 is very obvious, while there is a general net population outflow in other cities in the province.
Chart: statistics of population inflow and outflow from cities (unit)

Source: local Statistical Bulletin, WIND, China-Thailand Securities Research Institute
For example, the resident populations of Henan, Hubei, Hunan, Sichuan and Shanxi provinces are obviously concentrated in the provincial capitals. "Gemini" cities such as Fuzhou and Xiamen in Fujian, Guangzhou and Shenzhen in Guangdong, Hangzhou and Ningbo in Zhejiang, Jinan and Qingdao in Shandong are also very attractive to the population.
Chart:Distribution of population inflow and outflow in various cities of Shaanxi Province in 2018

Source: local Statistical Bulletin, China-Thailand Securities Research Institute
Note: red represents population inflow, blue represents population outflow, and color shade indicates relative range.
Chart:Distribution of population inflow and outflow in various cities of Fujian Province in 2018

Source: local Statistical Bulletin, China-Thailand Securities Research Institute
Note: red represents population inflow, blue represents population outflow, and color shade indicates relative range.
2
What drives the flow?Look at the economy and look at the policy.
It is easy to understand that economic factors are behind the flow of people.For example, most southern provinces are higher than the national average in terms of year-on-year GDP growth and household income growth. On the other hand, in the north, west and northeast regions, except for a few provinces, most of them are not satisfactory. The gap between urban economic vitality and residents' income level is an important reason for driving cross-regional population mobility.
Chart:Real GDP growth rate in 2018 (%)

Source: WIND, China-Thailand Securities Research Institute
Another major factor driving population mobility is population management policies, some "robbing people" and some controlling population growth.Among the cases of population control, the most typical are Beijing and Shanghai, where the former has the largest net population outflow, while the latter has a net inflow of only 10,000 people after becoming a regular employee in 2018 after three consecutive years of net outflow.
And there are several typical examples of "robbing people", such as 2018.In 2000, almost all the prefecture-level cities in Anhui had a net inflow.With the exception of Suzhou, Bengbu and Huainan in the north, there was a net population inflow in the other 13 cities of Anhui in 2018, with the largest inflow in Hefei, the provincial capital. The general net population inflow in Anhui is closely related to the policy of introducing talents in full swing. For high-end talents, Anhui cities directly give large housing subsidies, living expenses subsidies, family expenses subsidies, compared with the surrounding cities, the attraction is obviously enhanced.
Chart:Distribution of population inflow and outflow in various cities of Anhui Province in 2018

Source:Local Statistical Bulletin, China-Thailand Securities Research Institute
注:Red represents the inflow of population, blue represents the outflow of population, and the depth of color indicates the relative range.
In 2018,In the war of "robbing people", Xi'an also won a complete victory.In 2018, the net inflow of resident population in Shaanxi Province reached 119000, of which Xi'an accounted for nearly 320000. In 2018, the increase of resident population in Xi'an reached the highest level in nearly a decade, and the increase of registered permanent residents in one year is equivalent to the sum of the past decade.
The large influx of population in the short term has a lot to do with the relaxation of the settlement policy in Xi'an. Since 2017, Xi'an has relaxed the settlement policy five times in a row for college and secondary school graduates, students with higher academic qualifications. However, the high-cost "robbing" strategy may not be sustainable for a long time, and the future industrial and economic development is the key to whether the population can really return.
Chart:The increase of resident and registered population in Xi'an (10,000)

Source:Xi'an Statistical Bulletin, WIND, China-Thailand Securities Research Institute
Note: the population increment in 2017 and before adopted the old caliber (excluding Xianyang area of Xianyang New area) and adjusted to a new caliber in 2018 (new caliber in 2018-new caliber in 2017).
3
Urban agglomeration development:Where is the outflow of people from Beijing?
The policy of regional economic integration has been accelerated in the past two years, and the development of metropolitanization and urban agglomeration will become a new feature of urbanization in the era of stock economy.We compare the population mobility of four major urban agglomerations, namely, Beijing-Tianjin-Hebei, Yangtze River Delta, Pearl River Delta and Chengdu-Chongqing Circle, and find that there is an obvious new pattern of "three strong and one weak".
Chart:Distribution map of population mobility at the provincial level in 2018 (10,000 people)

Source: local Statistical Bulletin, WIND, China-Thailand Securities Research Institute
Note 1: the negative number less than-1 is the net population outflow, which is blue in the picture; the positive number greater than 1 is the net population inflow, which is red and orange in the figure; and the gray means that the population inflow and outflow is less than 10,000, which is regarded as little change in population migration.
Note 2: the data of Jilin, Yunnan and Tibet have not been released yet; the population change in Xinjiang will not be considered for the time being; the resident population in Shanxi Province is the projected data, not a sample survey, so the population mobility is calculated to be 0, which can not reflect the actual situation, so it is excluded and not considered.
The large net outflow of population from Beijing, Tianjin and Hebei is mainly the most serious in the Beijing area that we mentioned earlier. Has the outflow of population from Beijing gone to the area around Beijing, driving the development of the surrounding cities?
We found that the people flowing out of Beijing did not go to Tianjin, and the attractiveness of Tianjin's population increased from 2014.It began to weaken noticeably in 2000.In particular, in 2017, Tianjin saw a net outflow of more than 90, 000 people for the first time, and GDP growth fell to 3.6 per cent that year. Although Tianjin's economic growth has stabilized in 2018, the GDP growth rate is still the lowest in the country. Although the population has returned slightly, the net inflow is less than 10, 000, which is no longer the glory of the past.
Chart:Net inflow of population into Beijing and Tianjin since 2011 (10,000)

Source: local Statistical Bulletin, China-Thailand Securities Research Institute
I didn't go to Hebei either.Among the cities in Hebei Province, only Langfang (registered permanent residence) and Qinhuangdao saw net population inflows in 2018, with a size of 1.0 and 13000 respectively, which is negligible compared with the population outflow from Beijing. Not to mention, other cities in Hebei are still facing the pressure of net population outflow.
From the perspective of population, the long-term growth momentum of Beijing-Tianjin-Hebei urban agglomeration is weakening.With the outflow of population from Beijing and the relative lack of economic vitality in other cities, Beijing-Tianjin-Hebei as a whole is facing population loss, and the momentum of long-term economic growth may be weakening.
Chart:Distribution of population inflow and outflow in various prefecture-level cities of Hebei Province in 2018

Source:Local Statistical Bulletin, China-Thailand Securities Research Institute
注1:Red represents population inflow, blue represents population outflow, color shade indicates relative range, and light gray represents unreleased data.
注2:Langfang only released the relevant data on the registered population, which is the change of the registered population here.
The Yangtze River Delta urban agglomeration as a whole is still in a large net inflow, but the internal pattern is also in differentiation.Zhejiang population inflow continues to take the lead, and Anhui has become the biggest "dark horse". On the other hand, in Shanghai and Jiangsu, due to the control of the total population, Shanghai has a continuous population outflow in 15-17 years. Although there has been a net population inflow in 18 years, the scale of the net population inflow in Jiangsu has been small in recent years, and the net population inflow has been less than that in Anhui for six consecutive years.A few years ago, Anhui population mainly flowed to Shanghai, Jiangsu and Zhejiang, but now Anhui population is showing signs of return, these three major inflows may be affected to a certain extent.
Chart:2015年Net inflow of population from four provinces and cities in the Yangtze River Delta (10,000)

Source:Local Statistical Bulletin, WIND, China-Thailand Securities Research Institute
The Pearl River Delta region is also very attractive, and the population tends to the "Little Pearl River Delta" (9.The phenomenon of concentration is very obvious.According to the data released by Guangdong Province, the cities with population inflows are basically distributed in the "Little Pearl River Delta" region, especially Guangzhou and Shenzhen. Although Shenzhen has not released the relevant data yet, we simply estimate that the net population inflow of Shenzhen in 2018 may be about 500000 based on the inflow scale of the whole province of Guangdong. On the other hand, the attractiveness of other cities in the Pearl River Delta is relatively weak. for example, the population mobility of Shaoguan and Yunfu has not changed much, and the population of Qingyuan and Yangjiang is in net outflow.
Chart:Distribution of population inflow and outflow from prefecture-level cities in Guangdong Province in 2018

Source:Local Statistical Bulletin, WIND, China-Thailand Securities Research Institute
Note 1: red represents population inflow, blue represents population outflow, color depth indicates relative range, and light gray represents unpublished data.
Note 2: some prefecture-level cities use the approximate calculation of the birth rate and mortality rate of the registered population. Shenzhen has not released data yet, but compared with the situation in previous years and the scale of population inflow in the whole province in 18 years, it is still expected to inflow substantially.
The population migration of Chengdu-Chongqing urban agglomeration continues to show the characteristics of "Gemini" centered on Chengdu and Chongqing.The net population inflow of Chongqing in 2018 is nearly 160000; Chengdu has not yet released the relevant data on the natural population growth, but according to the net inflow of 53000 people in Sichuan province and the net population outflow of more than 100,000 people from other cities, we can simply calculate that the population of Chengdu is also inflow in 2018. However, like other urban agglomerations, small and medium-sized cities are also faced with the pressure of population outflow.
Chart:Distribution of population inflow and outflow in Chengdu-Chongqing urban agglomeration

Source:Local Statistical Bulletin, WIND, China-Thailand Securities Research Institute
注:Red represents population inflow, blue represents population outflow.The color depth indicates the relative amplitude, and the light gray represents the unpublished data.
4
There is a general net outflow from the small town, who will be the next "Hegang"?
From the perspective of urban hierarchy, the population is mainly concentrated in new first-tier cities, while 70% of the fourth-and fifth-tier cities are facing net population outflow!According to the statistics of the 169cities with published data, the population inflow of the new first-tier cities is very obvious. among the 11 new first-tier cities with existing data, the total net population inflow is 1.5 million. However, the inflow of population into first-tier cities is not obvious, mainly because there is too much outflow from Beijing, which has a big gap with the new first-tier cities. Third-and fourth-tier cities continue to have a net population outflow, especially in fourth-and fifth-tier cities, where 70% are facing the pressure of net population outflow.
Chart: net migration size (10,000)

Source: local Statistical Bulletin, China-Thailand Securities Research Institute
The rapid rise of house prices deviates from the flow of population, and the adjustment pressure on the small-town real estate market will be greater in the future.The general law of urbanization is that the population is concentrated from rural areas to cities and from small cities to big cities, while the real estate market in small cities in China has risen sharply in the past few years, which deviates from the fundamentals of increased supply and population outflow. In the long run, small cities face risks such as net population outflow and small second-hand housing market, and there will be greater pressure on the real estate market to adjust.
Chart:The ratio of population migration and house price increase in 2018 (%)

Source: local Statistical Bulletin, China-Thailand Securities Research Institute
In the long run, the growth rate of China's total population will gradually slow down, and there will be negative growth, and the macro-economy will gradually enter the era of stock economy. Japan's population has shown negative growth since 2010. House prices in Tokyo have outperformed the country in a decade, while house prices in other cities have been lukewarm.
Under the background of the policy of real estate in our country, the "war of robbing people" between various regions and cities will become more and more intense, and the urban economy and housing prices that can attract population inflow will have a certain support, and how will the cities facing net population outflow develop? this is indeed a problem that can not be ignored.In the long run, the "cabbage price" real estate in Hegang City may not be alone.
Chart:Japanese residential land price index (12-month moving average)

Source: WIND, China-Thailand Securities Research Institute
Risk hint: some cities unpublished data statistics are incomplete, economic downturn, policy changes.
