Calculating The Intrinsic Value Of Zhongmin Baihui Retail Group Ltd. (SGX:5SR)
Key Insights
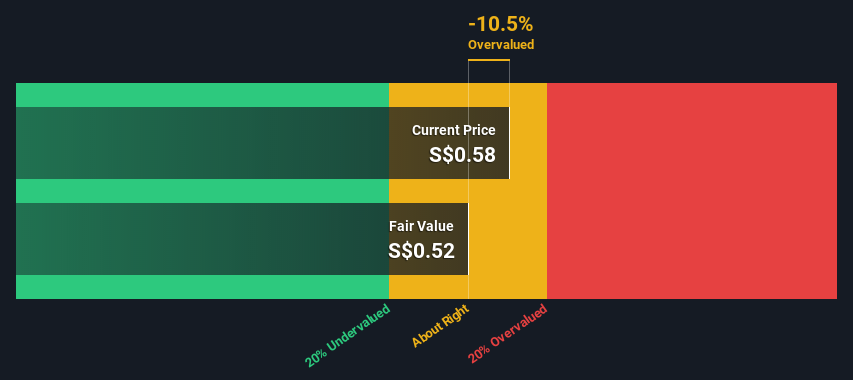
Zhongmin Baihui Retail Group's estimated fair value is S$0.52 based on 2 Stage Free Cash Flow to Equity
Current share price of S$0.58 suggests Zhongmin Baihui Retail Group is potentially trading close to its fair value
Industry average of 505% suggests Zhongmin Baihui Retail Group's peers are currently trading at a higher premium to fair value
Today we will run through one way of estimating the intrinsic value of Zhongmin Baihui Retail Group Ltd. (SGX:5SR) by taking the expected future cash flows and discounting them to their present value. We will use the Discounted Cash Flow (DCF) model on this occasion. Don't get put off by the jargon, the math behind it is actually quite straightforward.
We generally believe that a company's value is the present value of all of the cash it will generate in the future. However, a DCF is just one valuation metric among many, and it is not without flaws. For those who are keen learners of equity analysis, the Simply Wall St analysis model here may be something of interest to you.
Check out our latest analysis for Zhongmin Baihui Retail Group
Crunching The Numbers
We use what is known as a 2-stage model, which simply means we have two different periods of growth rates for the company's cash flows. Generally the first stage is higher growth, and the second stage is a lower growth phase. To begin with, we have to get estimates of the next ten years of cash flows. Seeing as no analyst estimates of free cash flow are available to us, we have extrapolate the previous free cash flow (FCF) from the company's last reported value. We assume companies with shrinking free cash flow will slow their rate of shrinkage, and that companies with growing free cash flow will see their growth rate slow, over this period. We do this to reflect that growth tends to slow more in the early years than it does in later years.
A DCF is all about the idea that a dollar in the future is less valuable than a dollar today, and so the sum of these future cash flows is then discounted to today's value:
10-year free cash flow (FCF) estimate
2023 | 2024 | 2025 | 2026 | 2027 | 2028 | 2029 | 2030 | 2031 | 2032 | |
Levered FCF (CN¥, Millions) | CN¥62.9m | CN¥55.6m | CN¥51.4m | CN¥48.9m | CN¥47.6m | CN¥47.0m | CN¥46.8m | CN¥47.0m | CN¥47.3m | CN¥47.9m |
Growth Rate Estimate Source | Est @ -17.48% | Est @ -11.65% | Est @ -7.58% | Est @ -4.73% | Est @ -2.73% | Est @ -1.33% | Est @ -0.35% | Est @ 0.33% | Est @ 0.81% | Est @ 1.15% |
Present Value (CN¥, Millions) Discounted @ 11% | CN¥56.9 | CN¥45.5 | CN¥38.1 | CN¥32.8 | CN¥28.9 | CN¥25.8 | CN¥23.3 | CN¥21.1 | CN¥19.3 | CN¥17.6 |
("Est" = FCF growth rate estimated by Simply Wall St)
Present Value of 10-year Cash Flow (PVCF) = CN¥309m
The second stage is also known as Terminal Value, this is the business's cash flow after the first stage. For a number of reasons a very conservative growth rate is used that cannot exceed that of a country's GDP growth. In this case we have used the 5-year average of the 10-year government bond yield (1.9%) to estimate future growth. In the same way as with the 10-year 'growth' period, we discount future cash flows to today's value, using a cost of equity of 11%.
Terminal Value (TV)= FCF2032 × (1 + g) ÷ (r – g) = CN¥48m× (1 + 1.9%) ÷ (11%– 1.9%) = CN¥569m
Present Value of Terminal Value (PVTV)= TV / (1 + r)10= CN¥569m÷ ( 1 + 11%)10= CN¥210m
The total value is the sum of cash flows for the next ten years plus the discounted terminal value, which results in the Total Equity Value, which in this case is CN¥519m. To get the intrinsic value per share, we divide this by the total number of shares outstanding. Compared to the current share price of S$0.6, the company appears around fair value at the time of writing. Remember though, that this is just an approximate valuation, and like any complex formula - garbage in, garbage out.
The Assumptions
We would point out that the most important inputs to a discounted cash flow are the discount rate and of course the actual cash flows. If you don't agree with these result, have a go at the calculation yourself and play with the assumptions. The DCF also does not consider the possible cyclicality of an industry, or a company's future capital requirements, so it does not give a full picture of a company's potential performance. Given that we are looking at Zhongmin Baihui Retail Group as potential shareholders, the cost of equity is used as the discount rate, rather than the cost of capital (or weighted average cost of capital, WACC) which accounts for debt. In this calculation we've used 11%, which is based on a levered beta of 1.443. Beta is a measure of a stock's volatility, compared to the market as a whole. We get our beta from the industry average beta of globally comparable companies, with an imposed limit between 0.8 and 2.0, which is a reasonable range for a stable business.
SWOT Analysis for Zhongmin Baihui Retail Group
Strength
Debt is not viewed as a risk.
Weakness
Current share price is above our estimate of fair value.
Opportunity
Has sufficient cash runway for more than 3 years based on current free cash flows.
Lack of analyst coverage makes it difficult to determine 5SR's earnings prospects.
Threat
No apparent threats visible for 5SR.
Next Steps:
Valuation is only one side of the coin in terms of building your investment thesis, and it ideally won't be the sole piece of analysis you scrutinize for a company. It's not possible to obtain a foolproof valuation with a DCF model. Preferably you'd apply different cases and assumptions and see how they would impact the company's valuation. If a company grows at a different rate, or if its cost of equity or risk free rate changes sharply, the output can look very different. For Zhongmin Baihui Retail Group, we've compiled three additional items you should further examine:
Risks: For instance, we've identified 3 warning signs for Zhongmin Baihui Retail Group (2 make us uncomfortable) you should be aware of.
Other Solid Businesses: Low debt, high returns on equity and good past performance are fundamental to a strong business. Why not explore our interactive list of stocks with solid business fundamentals to see if there are other companies you may not have considered!
Other Top Analyst Picks: Interested to see what the analysts are thinking? Take a look at our interactive list of analysts' top stock picks to find out what they feel might have an attractive future outlook!
PS. Simply Wall St updates its DCF calculation for every Singaporean stock every day, so if you want to find the intrinsic value of any other stock just search here.
Have feedback on this article? Concerned about the content? Get in touch with us directly. Alternatively, email editorial-team (at) simplywallst.com.
This article by Simply Wall St is general in nature. We provide commentary based on historical data and analyst forecasts only using an unbiased methodology and our articles are not intended to be financial advice. It does not constitute a recommendation to buy or sell any stock, and does not take account of your objectives, or your financial situation. We aim to bring you long-term focused analysis driven by fundamental data. Note that our analysis may not factor in the latest price-sensitive company announcements or qualitative material. Simply Wall St has no position in any stocks mentioned.
Join A Paid User Research Session
You’ll receive a US$30 Amazon Gift card for 1 hour of your time while helping us build better investing tools for the individual investors like yourself. Sign up here
