
 Yahoo Finance
 Returns On Capital At Sinostar PEC Holdings (SGX:C9Q) Paint A Concerning Picture
What are the early trends we should look for to identify a stock that could multiply in value over the long term? Firstly, we'll want to see a proven return on capital employed (ROCE) that is increasing, and secondly, an expanding base of capital employed. If you see this, it typically means it's a company with a great business model and plenty of profitable reinvestment opportunities. In light of that, when we looked at Sinostar PEC Holdings (SGX:C9Q) and its ROCE trend, we weren't exactly thrilled.
Return On Capital Employed (ROCE): What Is It?
If you haven't worked with ROCE before, it measures the 'return' (pre-tax profit) a company generates from capital employed in its business. The formula for this calculation on Sinostar PEC Holdings is:
Return on Capital Employed = Earnings Before Interest and Tax (EBIT) ÷ (Total Assets - Current Liabilities)
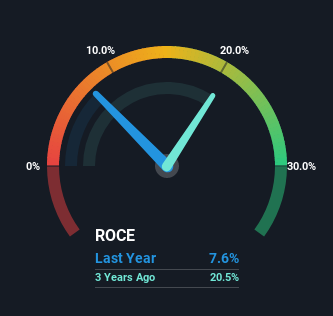
0.076 = CN¥163m ÷ (CN¥2.6b - CN¥421m) (Based on the trailing twelve months to December 2022).
So, Sinostar PEC Holdings has an ROCE of 7.6%. In absolute terms, that's a low return and it also under-performs the Oil and Gas industry average of 25%.
See our latest analysis for Sinostar PEC Holdings
While the past is not representative of the future, it can be helpful to know how a company has performed historically, which is why we have this chart above. If you want to delve into the historical earnings, revenue and cash flow of Sinostar PEC Holdings, check out these free graphs here.
What Can We Tell From Sinostar PEC Holdings' ROCE Trend?
On the surface, the trend of ROCE at Sinostar PEC Holdings doesn't inspire confidence. Over the last five years, returns on capital have decreased to 7.6% from 12% five years ago. However it looks like Sinostar PEC Holdings might be reinvesting for long term growth because while capital employed has increased, the company's sales haven't changed much in the last 12 months. It may take some time before the company starts to see any change in earnings from these investments.
In Conclusion...
Bringing it all together, while we're somewhat encouraged by Sinostar PEC Holdings' reinvestment in its own business, we're aware that returns are shrinking. Unsurprisingly, the stock has only gained 7.3% over the last five years, which potentially indicates that investors are accounting for this going forward. Therefore, if you're looking for a multi-bagger, we'd propose looking at other options.
On a final note, we've found 2 warning signs for Sinostar PEC Holdings that we think you should be aware of.
While Sinostar PEC Holdings may not currently earn the highest returns, we've compiled a list of companies that currently earn more than 25% return on equity. Check out this free list here.
Have feedback on this article? Concerned about the content? Get in touch with us directly. Alternatively, email editorial-team (at) simplywallst.com.
This article by Simply Wall St is general in nature. We provide commentary based on historical data and analyst forecasts only using an unbiased methodology and our articles are not intended to be financial advice. It does not constitute a recommendation to buy or sell any stock, and does not take account of your objectives, or your financial situation. We aim to bring you long-term focused analysis driven by fundamental data. Note that our analysis may not factor in the latest price-sensitive company announcements or qualitative material. Simply Wall St has no position in any stocks mentioned.
Join A Paid User Research Session
You’ll receive a US$30 Amazon Gift card for 1 hour of your time while helping us build better investing tools for the individual investors like yourself. Sign up here
