Here's Why We're Not Too Worried About Global Oil & Gas' (ASX:GLV) Cash Burn Situation
There's no doubt that money can be made by owning shares of unprofitable businesses. For example, although Amazon.com made losses for many years after listing, if you had bought and held the shares since 1999, you would have made a fortune. But while history lauds those rare successes, those that fail are often forgotten; who remembers Pets.com?
So, the natural question for Global Oil & Gas (ASX:GLV) shareholders is whether they should be concerned by its rate of cash burn. In this report, we will consider the company's annual negative free cash flow, henceforth referring to it as the 'cash burn'. Let's start with an examination of the business' cash, relative to its cash burn.
Check out our latest analysis for Global Oil & Gas
Does Global Oil & Gas Have A Long Cash Runway?
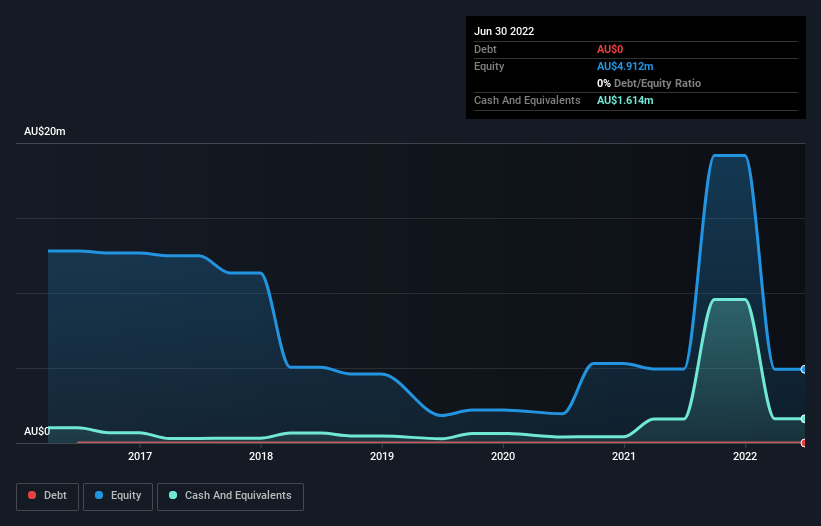
A company's cash runway is calculated by dividing its cash hoard by its cash burn. When Global Oil & Gas last reported its balance sheet in June 2022, it had zero debt and cash worth AU$1.6m. In the last year, its cash burn was AU$1.3m. Therefore, from June 2022 it had roughly 15 months of cash runway. While that cash runway isn't too concerning, sensible holders would be peering into the distance, and considering what happens if the company runs out of cash. You can see how its cash balance has changed over time in the image below.
How Is Global Oil & Gas' Cash Burn Changing Over Time?
Global Oil & Gas didn't record any revenue over the last year, indicating that it's an early stage company still developing its business. Nonetheless, we can still examine its cash burn trajectory as part of our assessment of its cash burn situation. During the last twelve months, its cash burn actually ramped up 54%. Oftentimes, increased cash burn simply means a company is accelerating its business development, but one should always be mindful that this causes the cash runway to shrink. Global Oil & Gas makes us a little nervous due to its lack of substantial operating revenue. So we'd generally prefer stocks from this list of stocks that have analysts forecasting growth.
How Hard Would It Be For Global Oil & Gas To Raise More Cash For Growth?
Given its cash burn trajectory, Global Oil & Gas shareholders may wish to consider how easily it could raise more cash, despite its solid cash runway. Issuing new shares, or taking on debt, are the most common ways for a listed company to raise more money for its business. Many companies end up issuing new shares to fund future growth. By looking at a company's cash burn relative to its market capitalisation, we gain insight on how much shareholders would be diluted if the company needed to raise enough cash to cover another year's cash burn.
Since it has a market capitalisation of AU$69m, Global Oil & Gas' AU$1.3m in cash burn equates to about 1.9% of its market value. That means it could easily issue a few shares to fund more growth, and might well be in a position to borrow cheaply.
Is Global Oil & Gas' Cash Burn A Worry?
Even though its increasing cash burn makes us a little nervous, we are compelled to mention that we thought Global Oil & Gas' cash burn relative to its market cap was relatively promising. Cash burning companies are always on the riskier side of things, but after considering all of the factors discussed in this short piece, we're not too worried about its rate of cash burn. Taking a deeper dive, we've spotted 6 warning signs for Global Oil & Gas you should be aware of, and 5 of them are a bit concerning.
Of course, you might find a fantastic investment by looking elsewhere. So take a peek at this free list of companies insiders are buying, and this list of stocks growth stocks (according to analyst forecasts)
Have feedback on this article? Concerned about the content? Get in touch with us directly. Alternatively, email editorial-team (at) simplywallst.com.
This article by Simply Wall St is general in nature. We provide commentary based on historical data and analyst forecasts only using an unbiased methodology and our articles are not intended to be financial advice. It does not constitute a recommendation to buy or sell any stock, and does not take account of your objectives, or your financial situation. We aim to bring you long-term focused analysis driven by fundamental data. Note that our analysis may not factor in the latest price-sensitive company announcements or qualitative material. Simply Wall St has no position in any stocks mentioned.
Join A Paid User Research Session
You’ll receive a US$30 Amazon Gift card for 1 hour of your time while helping us build better investing tools for the individual investors like yourself. Sign up here
