Tamawood Limited's (ASX:TWD) Stock Been Rising But Financials Look Weak: Should Shareholders Be Worried?
Tamawood's (ASX:TWD) stock is up by 9.5% over the past three months. However, its weak financial performance indicators makes us a bit doubtful if that trend could continue. Specifically, we decided to study Tamawood's ROE in this article.
Return on equity or ROE is an important factor to be considered by a shareholder because it tells them how effectively their capital is being reinvested. Put another way, it reveals the company's success at turning shareholder investments into profits.
See our latest analysis for Tamawood
How Is ROE Calculated?
Return on equity can be calculated by using the formula:
Return on Equity = Net Profit (from continuing operations) ÷ Shareholders' Equity
So, based on the above formula, the ROE for Tamawood is:
8.7% = AU$2.9m ÷ AU$33m (Based on the trailing twelve months to June 2022).
The 'return' is the yearly profit. One way to conceptualize this is that for each A$1 of shareholders' capital it has, the company made A$0.09 in profit.
What Is The Relationship Between ROE And Earnings Growth?
Thus far, we have learned that ROE measures how efficiently a company is generating its profits. Based on how much of its profits the company chooses to reinvest or "retain", we are then able to evaluate a company's future ability to generate profits. Generally speaking, other things being equal, firms with a high return on equity and profit retention, have a higher growth rate than firms that don’t share these attributes.
Tamawood's Earnings Growth And 8.7% ROE
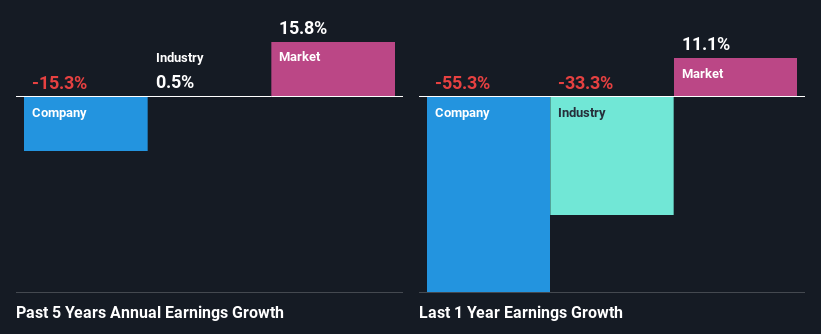
On the face of it, Tamawood's ROE is not much to talk about. However, given that the company's ROE is similar to the average industry ROE of 8.7%, we may spare it some thought. Having said that, Tamawood's five year net income decline rate was 15%. Bear in mind, the company does have a slightly low ROE. Hence, this goes some way in explaining the shrinking earnings.
So, as a next step, we compared Tamawood's performance against the industry and were disappointed to discover that while the company has been shrinking its earnings, the industry has been growing its earnings at a rate of 0.5% in the same period.
The basis for attaching value to a company is, to a great extent, tied to its earnings growth. What investors need to determine next is if the expected earnings growth, or the lack of it, is already built into the share price. Doing so will help them establish if the stock's future looks promising or ominous. If you're wondering about Tamawood's's valuation, check out this gauge of its price-to-earnings ratio, as compared to its industry.
Is Tamawood Using Its Retained Earnings Effectively?
Tamawood's very high three-year median payout ratio of 133% over the last three years suggests that the company is paying its shareholders more than what it is earning and this explains the company's shrinking earnings. Paying a dividend higher than reported profits is not a sustainable move. Our risks dashboard should have the 5 risks we have identified for Tamawood.
Moreover, Tamawood has been paying dividends for at least ten years or more suggesting that management must have perceived that the shareholders prefer dividends over earnings growth.
Summary
In total, we would have a hard think before deciding on any investment action concerning Tamawood. The low ROE, combined with the fact that the company is paying out almost if not all, of its profits as dividends, has resulted in the lack or absence of growth in its earnings. So far, we've only made a quick discussion around the company's earnings growth. You can do your own research on Tamawood and see how it has performed in the past by looking at this FREE detailed graph of past earnings, revenue and cash flows.
Have feedback on this article? Concerned about the content? Get in touch with us directly. Alternatively, email editorial-team (at) simplywallst.com.
This article by Simply Wall St is general in nature. We provide commentary based on historical data and analyst forecasts only using an unbiased methodology and our articles are not intended to be financial advice. It does not constitute a recommendation to buy or sell any stock, and does not take account of your objectives, or your financial situation. We aim to bring you long-term focused analysis driven by fundamental data. Note that our analysis may not factor in the latest price-sensitive company announcements or qualitative material. Simply Wall St has no position in any stocks mentioned.
Join A Paid User Research Session
You’ll receive a US$30 Amazon Gift card for 1 hour of your time while helping us build better investing tools for the individual investors like yourself. Sign up here
