
When you buy a stock there is always a possibility that it could drop 100%. But on the bright side, if you buy shares in a high quality company at the right price, you can gain well over 100%. For instance, the price of Zhejiang Xinan Chemical Industrial Group Co.,Ltd (SHSE:600596) stock is up an impressive 136% over the last five years. It's down 5.4% in the last seven days.
Although Zhejiang Xinan Chemical Industrial GroupLtd has shed CN¥1.0b from its market cap this week, let's take a look at its longer term fundamental trends and see if they've driven returns.
View our latest analysis for Zhejiang Xinan Chemical Industrial GroupLtd
To paraphrase Benjamin Graham: Over the short term the market is a voting machine, but over the long term it's a weighing machine. By comparing earnings per share (EPS) and share price changes over time, we can get a feel for how investor attitudes to a company have morphed over time.
Over half a decade, Zhejiang Xinan Chemical Industrial GroupLtd managed to grow its earnings per share at 59% a year. The EPS growth is more impressive than the yearly share price gain of 19% over the same period. So one could conclude that the broader market has become more cautious towards the stock. The reasonably low P/E ratio of 4.49 also suggests market apprehension.
You can see below how EPS has changed over time (discover the exact values by clicking on the image).
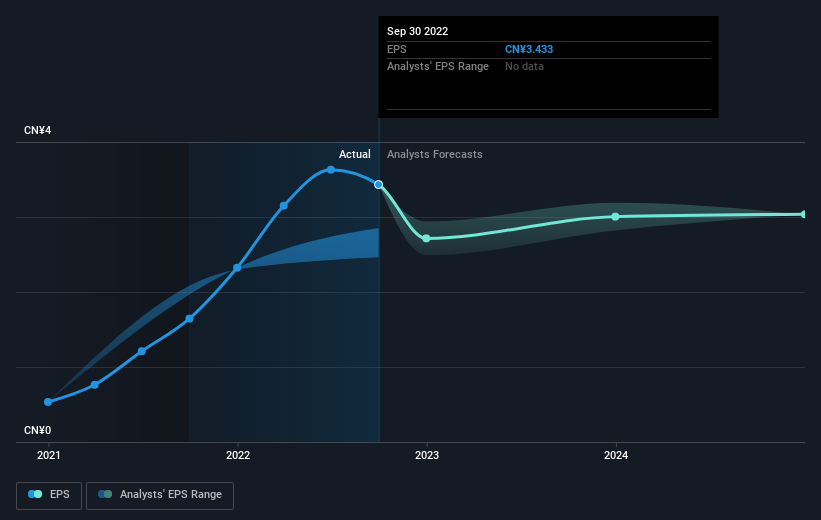 SHSE:600596 Earnings Per Share Growth December 23rd 2022
It is of course excellent to see how Zhejiang Xinan Chemical Industrial GroupLtd has grown profits over the years, but the future is more important for shareholders. If you are thinking of buying or selling Zhejiang Xinan Chemical Industrial GroupLtd stock, you should check out this FREE detailed report on its balance sheet.
What About Dividends?
When looking at investment returns, it is important to consider the difference between total shareholder return (TSR) and share price return. Whereas the share price return only reflects the change in the share price, the TSR includes the value of dividends (assuming they were reinvested) and the benefit of any discounted capital raising or spin-off. So for companies that pay a generous dividend, the TSR is often a lot higher than the share price return. As it happens, Zhejiang Xinan Chemical Industrial GroupLtd's TSR for the last 5 years was 157%, which exceeds the share price return mentioned earlier. This is largely a result of its dividend payments!
A Different Perspective
While it's certainly disappointing to see that Zhejiang Xinan Chemical Industrial GroupLtd shares lost 14% throughout the year, that wasn't as bad as the market loss of 19%. Of course, the long term returns are far more important and the good news is that over five years, the stock has returned 21% for each year. It could be that the business is just facing some short term problems, but shareholders should keep a close eye on the fundamentals. I find it very interesting to look at share price over the long term as a proxy for business performance. But to truly gain insight, we need to consider other information, too. Case in point: We've spotted 1 warning sign for Zhejiang Xinan Chemical Industrial GroupLtd you should be aware of.
If you like to buy stocks alongside management, then you might just love this free list of companies. (Hint: insiders have been buying them).
Please note, the market returns quoted in this article reflect the market weighted average returns of stocks that currently trade on CN exchanges.
Have feedback on this article? Concerned about the content? Get in touch with us directly. Alternatively, email editorial-team (at) simplywallst.com.
This article by Simply Wall St is general in nature. We provide commentary based on historical data and analyst forecasts only using an unbiased methodology and our articles are not intended to be financial advice. It does not constitute a recommendation to buy or sell any stock, and does not take account of your objectives, or your financial situation. We aim to bring you long-term focused analysis driven by fundamental data. Note that our analysis may not factor in the latest price-sensitive company announcements or qualitative material. Simply Wall St has no position in any stocks mentioned.