
Abstract: Sina's fourth-quarter net revenue increased 14% over the same period last year under both American accounting standards and non-American accounting standards, to $573 million and $570.4 million, respectively.
Tencent Technology News March 5, Sina released the fourth quarter of 2018 and annual results. Sina's fourth-quarter revenue is $573 million and is expected to be $569 million.
Focus on fourth quarter results in 2018
-net revenue rose 14% year-on-year under both American and non-American accounting standards, to $573 million and $570.4 million, respectively.
-Advertising revenue rose 14% from a year earlier to $484.3 million.
-non-advertising revenue rose 12% from a year earlier to $88.7 million. Non-GAAP non-advertising revenue rose 13% from a year earlier to $86.1 million.
-Sina's share of net profit was $16.4 million, or 22 cents per diluted net income per share. Sina's net profit attributable to non-GAAP was $57.7 million, or 80 cents per diluted net income per share.
-Weibo Corp's monthly active users ("MAUs") reached 462 million in December 2018, a net increase of about 70 million over the same period last year. 93% of Weibo Corp's monthly active users are mobile users.
-Weibo Corp's average number of daily active users ("DAUs") reached 200 million in December 2018, a net increase of about 28 million over the same period last year.
2018 performance focus
-net revenue increased by 33% over the previous year under both American accounting standards and non-American accounting standards, to $2.11 billion and $2.1 billion, respectively.
-Advertising revenue increased 36% from the previous year to $1.79 billion.
-non-advertising revenue increased 17% from the previous year to $319 million. Non-GAAP non-advertising revenue rose 18 per cent from the previous year to $308.6 million.
Sina's net profit attributable to 2018 was $125.6 million, or $1.70 per diluted share. Sina's net profit attributable to non-GAAP in 2018 was $227.1 million, or $3.07 per diluted share.
Corporate performance in the fourth quarter of 2018
Net revenue in the fourth quarter of 2018 was $573 million, up 14% from $503.7 million a year earlier. Non-GAAP net revenue was $570.4 million in the fourth quarter of 2018, up 14% from $501.1 million a year earlier.
Advertising revenue in the fourth quarter of 2018 was $484.3 million, up 14% from $424.8 million a year earlier. The year-on-year increase in advertising revenue in the fourth quarter was mainly due to Weibo Corp's advertising and marketing revenue growing at an annual rate of $84.7 million, or 25 per cent.
Non-advertising revenue in the fourth quarter of 2018 was $88.7 million, up 12% from $79 million a year earlier. Non-GAAP non-advertising revenue was $86.1 million in the fourth quarter of 2018, up 13% from $76.4 million a year earlier. The year-to-year growth in non-advertising revenue is mainly due to Weibo Corp's new acquisition of the live broadcast business in the fourth quarter of 2018.
The gross profit margin in the fourth quarter of 2018 was 79%, compared with 75% in the same period last year. The gross profit margin of the advertising business in the fourth quarter of 2018 was 82%, compared with 76% in the same period last year. The growth of advertising gross profit margin is mainly related to the company's adoption of new revenue criteria and the change of revenue presentation form from gross income to net income. The gross profit margin of the non-advertising business in the fourth quarter of 2018 was 57%, down from 66% in the same period last year, which is mainly related to the relatively low gross profit margin of the live broadcast business acquired by Weibo Corp.
Operating expenses were $319.9 million in the fourth quarter of 2018, compared with $248.4 million in the same period last year. The year-on-year increase in operating expenses in the fourth quarter was mainly related to the fact that marketing expenses related to swaps under the new revenue criteria were included in operating expenses, as well as goodwill and intangible asset impairment in non-core lines of business resulting from acquisitions. Non-GAAP operating expenses were $288.6 million in the fourth quarter of 2018, compared with $226.8 million in the same period last year.
Operating profit in the fourth quarter of 2018 was $130.1 million, compared with $128.7 million in the same period last year. Operating profit margin was 23% in the fourth quarter of 2018, down from 26% in the same period last year. Non-GAAP operating profit was $159.6 million in the fourth quarter of 2018, compared with $149.8 million in the same period last year. Non-GAAP operating margins were 28% in the fourth quarter of 2018, down slightly from 30% in the same period a year earlier.
The non-operating loss in the fourth quarter of 2018 was $12.6 million, compared with a non-operating profit of $7.7 million in the same period last year. The non-operating loss for the fourth quarter of 2018 includes (I) a net loss of $23 million resulting from the sale of investments, changes in the fair value of investments and impairment of investments, this loss does not include non-operating losses based on non-GAAP; (II) net interest and other income of $15.1 million; and (III) a net loss of $4.7 million on equity investments, which is deferred for one quarter. Non-operating earnings for the fourth quarter of 2017 included net interest and other income of $11.2 million and a loss of $2.8 million on equity investments, whose gains and losses were deferred by one quarter.
Income tax expenses in the fourth quarter of 2018 were $14.3 million, compared with $17.2 million in the same period last year.
Net profit attributable to Sina's common shareholders was $16.4 million in the fourth quarter of 2018, compared with $45.4 million a year earlier. The diluted net profit attributable to Sina common shareholders in the fourth quarter of 2018 was 22 cents per share, compared with 60 cents a year earlier. Net profit attributable to non-US GAAP Sina common shareholders was $57.7 million in the fourth quarter of 2018, compared with $60 million in the same period last year. In the fourth quarter of 2018, non-GAAP Sina common shareholders' diluted net profit per share was 80 cents, compared with 79 cents a year earlier.
Sina's cash, cash equivalents and short-term investments totaled $2.3 billion as of December 31, 2018 and $3.4 billion as of December 31, 2017. The decrease in Sina's cash, cash equivalents and short-term investments is mainly related to the company's investment activities, the implementation of the company's stock repurchase plan and the repayment of the company's convertible senior bonds. Net cash generated by operating activities in the fourth quarter of 2018 was $138.9 million, capital expenditure was $17.1 million, and depreciation and amortization expenses were $11.9 million.
Annual corporate performance in 2018
Full-year net revenue in 2018 was $2.11 billion, up 33 per cent from $1.58 billion in 2017. Non-GAAP net revenue for 2018 was $2.1 billion, up 33 per cent from $1.57 billion in 2017.
Advertising revenue for the whole of 2018 was $1.79 billion, up 36 per cent from $1.31 billion in 2017, mainly due to a 50 per cent increase in Weibo Corp's advertising and marketing revenue to $502.4 million.
Non-advertising revenue for the whole of 2018 was $319 million, up 17% from $272 million in 2017. Non-US GAAP non-advertising revenue for 2018 was $308.6 million, up 18 per cent from $261.6 million in 2017, thanks to the increase in Weibo Corp's membership fee income and revenue contribution from Weibo Corp's live broadcast business.
The gross profit margin for the whole of 2018 was 79 per cent, more than 74 per cent in 2017. The gross profit margin of the advertising business in 2018 was 81%, more than 75% in 2017. The growth of advertising gross profit margin in 2018 is mainly due to the change of revenue presentation form from gross income to net income under the new revenue criteria. The gross profit margin of the non-advertising business in 2018 was 65 per cent, slightly lower than the 67 per cent in 2017.
Operating expenses for the whole of 2018 were $1.19 billion, compared with $781.2 million in 2017. In addition to the swap-related marketing expenses required by the new revenue guidelines, the year-on-year increase in operating expenses is also related to the increase in sales and marketing expenses for Weibo Corp's acquisition of users, as well as the increase in personnel-related costs. Non-GAAP operating expenses were $1.07 billion in 2018 and $694.6 million in 2017.
Full-year operating profit was $467 million in 2018 and $388.6 million in 2017. Operating margins were 22 per cent in 2018, down from 25 per cent in 2017. Non-GAAP operating profit was $581.5 million in 2018 and $474 million in 2017. Non-GAAP operating margins were 28 per cent in 2018, slightly lower than the 30 per cent in 2017.
Non-operating profit for the whole of 2018 was $88.5 million, compared with $35.7 million in 2017. Non-operating earnings in 2018 mainly include: (1) net interest and other income of $69.4 million; (2) net income of $18 million from the sale of investments, changes in the fair value of investments and impairment of investments, this income does not include non-operating earnings based on non-GAAP; and (3) net income on equity investments of $1.1 million. The profit and loss of the equity investment is deferred for one quarter. The non-operating profit for the whole of 2017 mainly includes (1) net interest and other income of $42.7 million and (2) a loss of $16.1 million on equity investments. The gain or loss of the equity investment is deferred for one quarter; (3) the net gain of $9 million resulting from the sale of the investment, changes in the fair value of the investment and the impairment of the investment, which is not included in the non-operating earnings calculated in accordance with non-GAAP.
Income tax expenses were $129.1 million in 2018 and $74.7 million in 2017. The increase in income tax expenses is mainly related to higher profits in 2018 and deferred income tax expenses caused by changes in the fair value of investment. Non-GAAP income tax expenses were $91 million in 2018 and $73.9 million in 2017.
Net profit attributable to Sina's common shareholders for the whole of 2018 was $125.6 million, compared with $156.6 million in 2017. The diluted net profit attributable to Sina common shareholders was $1.70 per share in 2018 and $2.09 in 2017. Net profit attributable to non-US GAAP Sina common shareholders was $227.1 million in 2018 and $207.9 million in 2017. Net diluted income per share attributable to non-GAAP Sina common shareholders was $3.07 in 2018, compared with $2.77 in 2017.
For the whole of 2018, net cash generated from operating activities was $311 million, capital expenditure was $262.2 million, and depreciation and amortization expenses were $41.2 million.
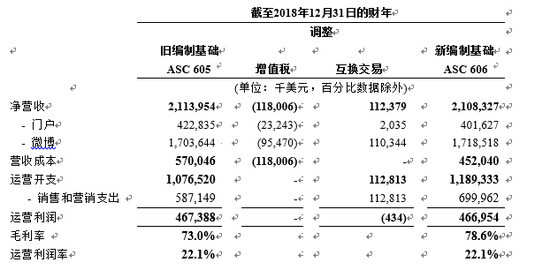
The financial impact of the new revenue standards
The company has adopted the new revenue standards since January 1, 2018, and the financial reports published after January 1, 2018 are prepared in accordance with the new revenue standards (the "new establishment basis"). The financial reports published before January 1, 2018 are still prepared in accordance with the old revenue standards (the "old establishment basis") and have not been adjusted. The old establishment is based on the accounting methods adopted in the history of the company.
The impact of the company's adoption of the new revenue guidelines on the current financial results is as follows:
Performance outlook
Sina expects 2019 GAAP net revenue to be between 16.5 billion and 17.5 billion yuan, or $2.44 billion to $2.59 billion, based on the exchange rate of 6.75 yuan to the dollar. The guidelines represent an annual growth rate of between 18% and 25% for net income. The revenue is expected to include $10.4 million in deferred revenue related to the concession to Leju Holdings Ltd. The above expectations reflect Sina's current preliminary judgment and may be adjusted in the future.