
 Yahoo Finance
 Slowing Rates Of Return At First Ship Lease Trust (SGX:D8DU) Leave Little Room For Excitement
If you're looking for a multi-bagger, there's a few things to keep an eye out for. In a perfect world, we'd like to see a company investing more capital into its business and ideally the returns earned from that capital are also increasing. Ultimately, this demonstrates that it's a business that is reinvesting profits at increasing rates of return. In light of that, when we looked at First Ship Lease Trust (SGX:D8DU) and its ROCE trend, we weren't exactly thrilled.
Return On Capital Employed (ROCE): What Is It?
For those that aren't sure what ROCE is, it measures the amount of pre-tax profits a company can generate from the capital employed in its business. To calculate this metric for First Ship Lease Trust, this is the formula:
Return on Capital Employed = Earnings Before Interest and Tax (EBIT) ÷ (Total Assets - Current Liabilities)
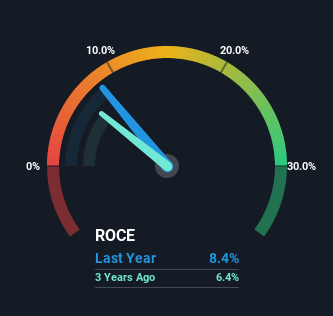
0.084 = US$4.8m ÷ (US$61m - US$4.2m) (Based on the trailing twelve months to September 2022).
Therefore, First Ship Lease Trust has an ROCE of 8.4%. On its own that's a low return on capital but it's in line with the industry's average returns of 8.4%.
Check out our latest analysis for First Ship Lease Trust
While the past is not representative of the future, it can be helpful to know how a company has performed historically, which is why we have this chart above. If you want to delve into the historical earnings, revenue and cash flow of First Ship Lease Trust, check out these free graphs here.
What Can We Tell From First Ship Lease Trust's ROCE Trend?
We've noticed that although returns on capital are flat over the last five years, the amount of capital employed in the business has fallen 73% in that same period. To us that doesn't look like a multi-bagger because the company appears to be selling assets and it's returns aren't increasing. Not only that, but the low returns on this capital mentioned earlier would leave most investors unimpressed.
One more thing to note, even though ROCE has remained relatively flat over the last five years, the reduction in current liabilities to 7.0% of total assets, is good to see from a business owner's perspective. Effectively suppliers now fund less of the business, which can lower some elements of risk.
In Conclusion...
Overall, we're not ecstatic to see First Ship Lease Trust reducing the amount of capital it employs in the business. Yet to long term shareholders the stock has gifted them an incredible 361% return in the last five years, so the market appears to be rosy about its future. Ultimately, if the underlying trends persist, we wouldn't hold our breath on it being a multi-bagger going forward.
One more thing: We've identified 3 warning signs with First Ship Lease Trust (at least 1 which makes us a bit uncomfortable) , and understanding them would certainly be useful.
While First Ship Lease Trust isn't earning the highest return, check out this free list of companies that are earning high returns on equity with solid balance sheets.
Have feedback on this article? Concerned about the content? Get in touch with us directly. Alternatively, email editorial-team (at) simplywallst.com.
This article by Simply Wall St is general in nature. We provide commentary based on historical data and analyst forecasts only using an unbiased methodology and our articles are not intended to be financial advice. It does not constitute a recommendation to buy or sell any stock, and does not take account of your objectives, or your financial situation. We aim to bring you long-term focused analysis driven by fundamental data. Note that our analysis may not factor in the latest price-sensitive company announcements or qualitative material. Simply Wall St has no position in any stocks mentioned.
Join A Paid User Research Session
You’ll receive a US$30 Amazon Gift card for 1 hour of your time while helping us build better investing tools for the individual investors like yourself. Sign up here
