
Author: Chen Xi / Wei Wei / Yang Xuan, Macro Group of Ping an Securities
Peace viewpoint
GDP grew by 6.6% in 2018, down 0.2 percentage points from 6.8% in 2017. For the current economic situation, we have the following basic analysis and judgment: the GDP growth rate of ① in 2018 is the lowest since the 1990s, but considering that China has become the world's second largest economy after the United States, a corresponding slowdown in economic growth is inevitable, which should be treated objectively and calmly. The economic structure of ② is gradually optimized, and the pull of net exports on GDP growth has significantly weakened in 2018. This gap is basically made up by final consumer expenditure. Combined with the relatively weak trend of social zero consumption growth, the relative strength of final consumer expenditure is more likely to be provided by service consumption (such as education, medical and entertainment). The downward pressure on the ③ economy is indeed strong in the short term, as can be seen from the rapid downward trend of the PMI index in September (now falling to the contraction range), the accelerated decline in profit growth of industrial enterprises in August, and the continuous sharp declines in import and export growth in November and December. In the future, the pressure on foreign trade and investment is expected to increase accordingly. ④ policy is expected to be a high probability event, in order to hedge the downward pressure on the economy, increase the deficit ratio, expand the issuance of local government special bonds, continue to lower the reserve requirement, reduce the public operating interest rate (or even lower the benchmark interest rate) can be said to be the expected options. ⑤ overall, considering that policy efforts will provide some support to the economy, we believe that economic growth will only decline slightly in 2019 (GDP growth is expected to slow to 6.3% in 2019). At the same time, with the gradual emergence and strengthening of policy effects, economic growth may show signs of stabilizing in the second half of the year.
Although we believe that policy support will help the future economic situation, it is relatively unlikely that policy will return to the 2009-style economic stimulus and lead to a rebound in economic growth, including the following reasons: ① should not expect too much from the expansion of government explicit debt. Although the deficit ratio and the scale of local government special debt will be expanded, under the constraints of fiscal discipline, the probability of a huge increase in this kind of government explicit debt is still very low, and the high probability of land revenue will be significantly weakened. to a certain extent, it will reduce the effectiveness of debt expansion. The expectation of ② on the actual effect of tax reduction and the pick-up of infrastructure growth (the prying role of financial funds) should not be too high. During the economic downward cycle, the risk appetite of residents and businesses will decline accordingly, so the increase in income brought about by tax cuts will not be fully translated into effective demand (consumption and investment). In terms of infrastructure, in recent years, the high growth rate of infrastructure investment is mainly due to the implicit leverage of local governments (behind which is the credit endorsement of local governments, the just exchange of urban investment bonds) and all kinds of financial innovations that escape regulatory constraints (capital pools, credit tables, layers of nested hiding of underlying assets, maturity mismatch, etc.). Strong support, so under the background of the local government debt and financial risk prevention and control framework remains unchanged Only relying on the expansion of local government special debt and deficit ratio, it is difficult to bring about a substantial rebound in infrastructure growth, and it is difficult for financial funds to play a huge prying role as in previous years. The dredging effect of ③ monetary policy transmission also remains to be seen. The capital constraints in the balance sheet of commercial banks, the general framework of the new rules on foreign investment management, the risk preference of banks and the risk preference of enterprises (reduced effective demand) will all affect the implementation effect of monetary policy in 2019. The pressure on foreign trade of ④ will be further increased. The downward pressure on the global economy will increase in 2019, and there is a great probability that both import and export growth rates will decline. The accumulation of declining surplus (a greater decline in imports relative to exports leads to an increase in the surplus) may be difficult to appear, the Sino-US trade surplus is likely to shrink, and the United States is the largest source of China's trade surplus, so China's trade surplus is expected to narrow. The long-term negative factors of the huge stock debt of ⑤ and the reduction of demographic dividend can not be ignored.
Overall, policy support will hedge against downward pressure on the economy to some extent, and the international situation will improve as trade disputes between China and the United States ease. Economic growth is expected to remain basically stable in 2019.
I. growth is still weak and policy expectations are on the rise.
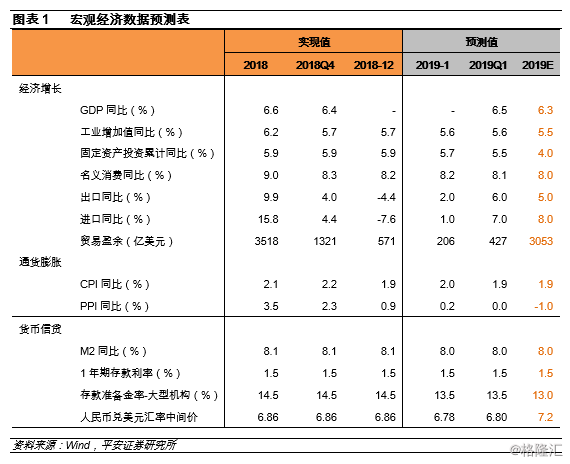
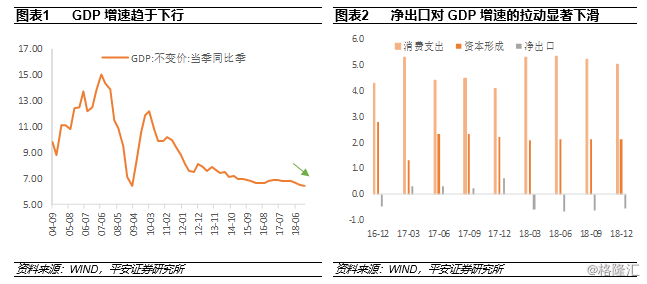
GDP growth in 2018 was 6.6 per cent, down 0.2 percentage points from 6.8 per cent in 2017 (the Bureau of Statistics revised 2017 GDP growth down from 6.9 per cent to 6.8 per cent). GDP growth in the first, second, third and fourth quarters of 2018 was 6.8%, 6.7%, 6.5% and 6.4%, respectively. Structurally, the pull of consumption, investment and net exports on GDP was 5.0,2.1 and-0.6 percentage points respectively, of which consumption increased by 0.9 percentage points compared with 2017, while investment and net exports fell by 0.1 percentage points and 1.2 percentage points respectively.
For the current economic situation, we have the following basic analysis and judgment: the GDP growth rate of ① in 2018 is the lowest since the 1990s, but considering that China has become the world's second largest economy after the United States, a corresponding slowdown in economic growth is inevitable, which should be treated objectively and calmly. The economic structure of ② is gradually optimized, and the pull of net exports on GDP growth has significantly weakened in 2018. This gap is basically made up by final consumer expenditure. Combined with the relatively weak trend of social zero consumption growth, the relative strength of final consumer expenditure is more likely to be provided by service consumption (such as educational services, medical services, entertainment services, etc.). The short-term downward pressure on the ③ economy is indeed great, as can be seen from the rapid downward trend of the PMI index in September (now falling to the contraction range), the accelerated decline in profit growth of industrial enterprises in August, and the continuous sharp declines in import and export growth in November and December. In the future, the pressure on foreign trade and investment is expected to increase accordingly. ④ policy is expected to be a high probability event, in order to hedge the downward pressure on the economy, increase the deficit ratio, expand the issuance of local government special bonds, continue to lower the reserve requirement, reduce the public operating interest rate (or even lower the benchmark interest rate) can be said to be the expected options. ⑤ overall, considering that policy efforts will provide some support to the economy, we believe that economic growth will only decline slightly in 2019. At the same time, with the gradual appearance and increase of policy effects, economic growth may show signs of stabilizing in the second half of the year.
Although we believe that policy support will help the future economic situation, it is relatively unlikely that policy will return to the 2009-style economic stimulus and lead to a rebound in economic growth, for the following reasons:① should not expect too much from the expansion of government explicit debt.Although the deficit ratio and the scale of local government special debt will be expanded, under the constraints of fiscal discipline, the probability of a huge increase in such government explicit debt (such as doubling the deficit ratio) is still relatively low, at the same time, land revenue is likely to be significantly weaker, which will reduce the effectiveness of debt expansion to a certain extent.The expectation of ② on the actual effect of tax reduction and the pick-up of infrastructure growth (the prying role of financial funds) should not be too high.First of all, during the economic downward cycle, the risk appetite of residents and businesses will decline accordingly, so the income increase brought about by tax cuts will not be fully translated into effective demand (consumption and investment). In terms of infrastructure, in recent years, the high growth rate of infrastructure investment is mainly due to the implicit leverage of local governments (behind which is the credit endorsement of local governments, the just exchange of urban investment bonds) and all kinds of financial innovations that escape regulatory constraints (capital pools, credit tables, layers of nested hiding of underlying assets, maturity mismatch, etc.). Strong support, so under the background of the local government debt and financial risk prevention and control framework remains unchanged Only relying on the expansion of local government special debt and deficit ratio, it is difficult to bring about a substantial rebound in infrastructure growth, and it is difficult for financial funds to play a huge prying role as in previous years.The dredging effect of ③ monetary policy transmission also remains to be seen.The capital constraints in the balance sheet of commercial banks, the general framework of the new rules on foreign investment management, the risk preference of banks and the risk preference of enterprises (reduced effective demand) will all affect the implementation effect of monetary policy in 2019.The pressure on foreign trade of ④ will be further increased.The growth rate of imports and exports in 2018 is considerable, but in the context of increasing downward pressure on the global economy in 2019, there is a high probability of both going down. At the same time, the accumulation of a recessionary surplus (a larger decline in import growth relative to exports) is also likely to be difficult to occur in 2019, because the Sino-US trade surplus is likely to shrink and the United States is the largest source of China's trade surplus. therefore, China's trade surplus is expected to narrow in 2019.The long-term negative factors of the huge stock debt of ⑤ and the reduction of demographic dividend can not be ignored.Behind the huge stock of debt is the huge pressure of debt service and interest payment: if the interest rate of 6% is used to estimate, more than 40% of the net new financing of social finance in China needs to be used to pay interest; a considerable proportion of the total financing also needs to be used to borrow the new to repay the old. In 2018, the total repayment of non-financial credit debt accounted for 67% of the total issuance, and only 30% of the net new financing. In terms of population, China's birth population shrank for the second year in a row in 2018, and the decline of 2 million of the export population in 2018 was significantly larger than that of 600000 in 2017.
Overall, policy support will hedge against downward pressure on the economy to some extent, and the international situation will improve as trade disputes between China and the United States ease. Economic growth is expected to remain basically stable in 2019.
Second, the production side:The decline of industrial production accelerated in the second half of the year
Industrial production grew by 6.2 per cent in 2018, down slightly from 6.6 per cent in 2017. The growth rates of industrial added value in the first, second, third and fourth quarters were 6.8%, 6.6%, 6.0% and 5.7%, respectively. It can be seen that the overall growth trend of industrial added value in 2018 is downward, but the prosperity of industrial production in the first half of 2018 is still OK. The growth rate is higher than that of the whole year of 2017, but after entering the second half of the year, the growth rate of industrial added value has obviously weakened. Its cumulative growth rate also basically fell month by month in the second half of 2018. The slowest monthly growth rate in 2018 was in November, with a growth rate of just 5.4%, and the latest December data rebounded slightly to 5.7%.
Among the three major industries, the growth rate of industrial value added in 2018 is slightly higher than that in 2017, and the manufacturing industry is the main drag on industrial production. Based on the further analysis of the industry segments, combined with the decline of industry weight and growth rate, we think that the industries that have a greater drag on industrial value added are automobile manufacturing, electrical machinery manufacturing, general equipment manufacturing and textile industry. its growth rate fell by 7.3, 3.3, 3.3 and 3.0 percentage points respectively, taking into account the relatively higher weight of automobile and electrical machinery manufacturing. The drag on industrial value added in these two areas should be more significant. The weakness of the automobile manufacturing industry is directly negatively affected by the downward growth of car sales, which is a drag on optional large consumer goods by the expectation of economic downturn and the decline in the wealth effect of real estate. The weakness of the electrical and machinery manufacturing industry is directly negatively affected by the downward growth rate of infrastructure investment. In addition, environmental protection requirements, private enterprise financing environment and other factors may also bring related drag on the industrial production of some small enterprises.
Steel and non-ferrous industries have brought strong support to industrial value added data: the growth rate of added value of ferrous metal smelting and non-ferrous metal smelting industry has increased sharply by 6.7% and 6.3% compared with 2017, taking into account the relatively higher weight of ferrous metal smelting, the support brought by the stronger industrial production data of the iron and steel industry. However, we believe that in the context of obviously weaker demand, the "strength" of industrial production in the iron and steel industry should be more caused by statistical factors: on the demand level, the growth rate of infrastructure has dropped sharply from 14.9% in 2017 to 1.8% in 2018. The growth rate of real estate construction installation dropped sharply from 3.0% in 2017 to-3.7% in 2018, while demand was significantly weaker. Instead, the price of steel (rebar spot) rose by 7.7%. The combination of weaker demand, stronger supply and rising prices obviously goes against the basic logic. for this, we believe that the production end of the overall iron and steel industry should have contracted in 2018. The strengthening of production in statistics should be due to the increase in the market share of large enterprises in the statistical samples after the small enterprises outside the statistical samples have been cleared.So it seems that the strong data of iron and steel and non-ferrous industries may have a statistical beautification effect on the support of industrial value added, and the actual industrial production situation may be worse than the performance of the data.From the point of view that PMI began to decline in September 2018 and fell into the contraction range, the current economic situation in the manufacturing sector is not optimistic.
Looking ahead, we believe that the growth rate of industrial production will continue to decline in 2019. Although the stabilization and rebound of infrastructure investment growth in recent months has brought an upward effect on the industrial production momentum of some industries (railways and other transport equipment, power machinery manufacturing), considering that it is difficult for ① infrastructure investment growth rate to significantly return to the high double-digit growth rate of previous years, the logic of ② economic downturn and real estate wealth effect reduction will still exist, and automobile consumption is expected to remain depressed. The beautification effect at the statistical level of ③ will gradually fade away, and the downward trend of real estate investment will further affect the demand of relevant industrial chains (steel, etc.), the downward pressure of ④ export growth will affect the production of related industries, the first weakening of ⑤ demand in 2018 will cause enterprises to passively replenish the inventory, and enterprises will take the initiative to go to the warehouse in the future will promote the production side to weaken. In the short term, the growth rate of industrial production is expected to slow slightly to 5.6% from January to February 2019.


Third, the demand side:Investment growth is declining and trade surplus is narrowing
3.1 Investment growth slows in 2018 and is expected to continue to decline in 2019
Fixed asset investment grew by 5.9% in 2018 (7.2% in 2017), real estate investment grew by 9.5% (7.0% in 2017), manufacturing investment grew by 9.5% (4.8% in 2017), and infrastructure investment, including power, grew by 1.8% (14.9% in 2017). The growth rate of fixed asset investment declined in the first eight months of 2018, and slightly stabilized and rebounded in the past four months as the growth rate of infrastructure investment stabilized and rebounded and manufacturing investment continued to strengthen.
Investment in the manufacturing sector continued to rise in the second quarter of 2018, and the growth rate in 2018 was 4.7 percentage points higher than that in 2017.
The development of high-end manufacturing industry and the increase of investment demand related to pollution prevention are the main reasons for driving up the growth rate of manufacturing investment.Combined with the two dimensions of the growth rate of investment in subdivided industries and the weight of the industry, we find that the following two areas are the main sources of investment growth in the manufacturing industry: one is the high-end manufacturing industry. the representative industries are general equipment manufacturing, special equipment manufacturing and electrical machinery manufacturing, with growth rates of 4.7, 10.7 and 7.4 percentage points respectively in 2018. The other is the related industries that are focused on by the environmental protection policy, representing the iron and steel, chemical and non-metallic products (building materials) manufacturing industries, with a sharp increase of 20.1%, 10.0% and 18.7% respectively (the iron and steel and building materials industries are calculated according to the latest November data). Looking ahead, considering that the passive investment pressure caused by environmental protection factors may be reduced in 2019, corporate profits are weakening, and the financing environment is difficult to improve significantly, the growth rate of investment in the manufacturing industry is expected to decline.
The growth rate of real estate investment in 2018 is 2.5% higher than that in 2017, which is mainly driven by the delayed payment of land purchase fees. structurally, the cumulative growth rate of land purchase fees in November 2018 is as high as 60.5% (23.4% in 2017). The cumulative growth rate of Jian'an investment is-3.7% (3.0% in 2017). Among other important items, the growth rate of construction area and new construction area increased by 2.2% and 10.2% respectively in 2018, and the growth rate of land transaction price dropped sharply by 31.4%. The growth rate of commercial housing sales area and sales fell by 6.4 and 1.5 percentage points respectively. The growth rate of the source of funds for real estate development fell by 1.9 percentage points, of which the growth rate of loans dropped sharply by 22.2 percentage points, and the investment funds of real estate enterprises were more supported by deposits and advances. Looking ahead, although the real estate policy in 2019 will be changed to "policy based on the city", under the background of the weakening of the monetized resettlement of shed reform, the relaxation of policies in third-and fourth-tier cities is not expected to bring about a pick-up in the sales side. Taking into account the weakening of the price effect of building materials, the fading of the deferred payment effect of land purchase fees (the growth rate of land transaction prices in 2018 is sharply lower than that in 2017), and the decline in the willingness of housing enterprises to further purchase land (tight capital, weak sales) and other factors.We expect that the growth rate of real estate investment will still face a lot of downward pressure in the future, and it is expected that the growth rate of real estate investment will drop sharply to about 2% in 2019.
The growth rate of infrastructure investment (including electricity) fell sharply by 13.1 percentage points in 2018 compared with 2017, but with policy support, infrastructure growth has stabilized slightly in the past three months. We believe that the overall growth rate of infrastructure in 2019 can continue the current upward trend, and there has also been a significant increase in the approval of infrastructure projects by the NDRC in December (mainly in the areas of rail transportation and railways). However, the high growth rate of infrastructure investment in recent years is mainly due to the implicit leverage of local governments (behind which is the credit endorsement of local governments, the just exchange of urban investment bonds) and all kinds of financial innovations that escape regulatory constraints (capital pools, credit tables, layers of nested hiding of underlying assets, maturity mismatch, etc.). Strong support, under the background of local government debt and financial risk prevention and control framework does not change The expansion of local government special debt and deficit ratio alone will not lead to a significant rebound in infrastructure growth, so we expect infrastructure investment growth to pick up only slightly to around 5.0% in 2019.
Overall, infrastructure investment growth is likely to pick up slightly in 2019, but both real estate investment growth and manufacturing investment growth will be under pressure. We expect investment growth to slow to 4.0% in 2019. From January to February, investment growth will slow to 5.7%.


3.2 consumption growth continues the downward trend, with automobile consumption dragging down the most
In 2018, nominal consumption grew by 9.0% (10.2% in 2017), and real consumption grew by 6.9% (9.0% in 2017). In the trend, the growth rate of social zero consumption basically maintained a downward trend, with the lowest monthly growth rate in November, with a growth rate of only 8.1%, and consumption growth only slightly rebounded to 8.2% in December.
Structurally, retail and catering revenues fell by 1.3 and 1.2 percentage points respectively in 2018. In terms of commodity retail structure, automobile and real estate-related consumption (building materials, furniture, electrical appliances) and traditional Chinese and western medicine have a negative impact on consumption growth, of which automobile consumption is the most important negative drag. Its growth rate dropped sharply from 5.6% in 2017 to-2.4%, a drop of 8.0 percentage points. The growth rate of consumption of building materials, furniture and electrical appliances fell by 2.2%, 2.7% and 0.4% respectively. The growth rate of consumption of Chinese and western medicines also fell by 3.0 percentage points. The strength of oil prices in 2018 led to a significant strengthening of oil consumption, with a growth rate of 4.1 percentage points, providing some support to consumption growth. In addition, it is worth mentioning that there is also a beautification effect brought about by statistical factors in the growth rate of social zero consumption. there is a significant difference between the growth rate calculated by absolute data and the published comparable growth rate, and the statistical caliber of "regulation" excludes some enterprises whose performance falls below the standard of "regulation".
Looking ahead, the growth rate of social zero consumption in 2019 is expected to continue to decline, and the pressure will come from the downward expectation of the ① economy and the reduction of the wealth effect brought by real estate. At the same time, the decline in economic growth will also affect the growth rate of residents' income. After nearly a decade of rapid increase in the leverage ratio of ② residents, the interest pressure has increased significantly. High-priced service consumption such as ③, education and health care should also crowd out commodity consumption, and the growth rate of ④ oil prices is likely to decline. We expect social zero consumption growth to slow to 8.0% for 2019 as a whole.

3.3 The growth rate of foreign trade for the whole year is basically optimistic, but it has declined rapidly in the past two months.
From the perspective of 2018 as a whole, China's import and export growth continues to be high: export growth of 9.9% (7.9% in 2017) and import growth of 15.8% (16.1% in 2017). Although the growth rate for the whole year still looks optimistic, the recent foreign trade situation has shown obvious signs of deterioration. This can be clearly seen from the changes in the growth trend in the four quarters: China's export growth rate in the first, second, third and fourth quarters was 13.0%, 10.9%, 11.6% and 4.0%, respectively. China's imports grew by 19.1%, 19.9%, 20.7% and 4.4% in the first, second, third and fourth quarters, respectively. Monthly data show that the significant decline in China's import and export growth began in November, with export growth falling by 18.7 percentage points and import growth by 27.9 percentage points between November and December.
In 2018, China's trade surplus in goods was 351.8 billion US dollars, down 67.8 billion US dollars from 419.6 billion US dollars in 2017. China's trade surplus in goods in the first, second, third and fourth quarters was 450,906,841 and 132.1 billion US dollars respectively. China's trade surplus in goods increased significantly in the fourth quarter, which is mainly due to the larger decline in the growth rate of imports compared with exports in November and December, that is to say, the expansion of the trade surplus in the fourth quarter is driven by the logic of declining surplus accumulation.
There has been a general decline in the growth rate of imports and exports to different trading partners.In terms of exports, the growth rate of China's exports to the United States, Japan, Europe, ASEAN and Hong Kong has declined significantly for two consecutive months, with a cumulative decline of 16.7, 8.9, 14.9, 9.4 and 49.6 percentage points respectively. In terms of imports, the growth rate of China's imports to the United States, Europe, ASEAN, South Korea, Japan and Taiwan also declined significantly for two consecutive months, falling by 34.0, 15.0, 34.6, 34.9, 22.8 and 29.8 percentage points respectively. Thus it can be seen that China's imports and exports to its major trading partners are generally weak, and the obvious deterioration of foreign trade data is not only the negative impact of trade disputes.
The weakening of imports and exports is also universal at the commodity level.In terms of exports, the growth rate of exports of labor-intensive products, high-tech products and mechanical and electrical products in December decreased by 7.1%, 13.1% and 9.9% respectively compared with November. Automatic data processing equipment and components, clothing, handheld telephones, and agricultural products all declined significantly in the past two months. In terms of imports, compared with the October level, the growth rate of crude oil imports fell by 46.3%, agricultural products by 26.9%, cars by 13.9%, plastics by 28.3%, copper by 34.2% and steel by 37.1%. In other words, weighted imports have generally weakened in the past two months, with only iron ore imports performing relatively well in December. It is worth mentioning that in the past two months, the cumulative drag of crude oil on import growth is only 3.6 percentage points, while the overall import growth rate has dropped by 27.9 percentage points. Therefore, the current import growth performance can not be simply attributed to a single external factor such as the fall in international oil prices.
Generally speaking, although the growth rate of China's import and export for the whole year is still basically optimistic, the growth rate of China's foreign trade has declined rapidly in the past two months. Considering that there is a very obvious universal weakening of China's different trading partners and different import and export commodities, the reasons for the recent changes in foreign trade cannot simply be attributed to single external factors such as the trade dispute between China and the United States and the decline in international oil prices. The weakening of global economic momentum, including China, should be a more appropriate explanation. The global economic situation in 2018 is dominated by the United States, and the current signs of weakness in the US economy further cast a shadow over the global economy in 2019. Under such a situation, the situation of China's foreign trade in 2019 is not optimistic. In terms of the contribution of foreign trade to economic growth, as the growth rate of imports has declined faster than that of exports in the past two months, the accumulation of recessionary surplus may help to enhance the contribution of a single area of foreign trade to economic growth in the short term. however, considering that the Sino-US trade negotiations will most likely move towards reducing the Sino-US trade surplus and the United States is the largest source of China's trade surplus. Therefore, the narrowing of China's overall trade surplus in 2019 should still be a high probability event.


IV. Prices:There is deflationary pressure on industrial product prices in 2019.
CPI grew 2.1 per cent year-on-year in 2018, up slightly from 1.6 per cent in 2017 and continuing to maintain a moderate level. In the first, second, third and fourth quarters of this year, the CPI was 2.2%, 1.8%, 2.3% and 2.2% respectively compared with the same period last year. Structurally, the slight increase in year-on-year CPI growth in 2018 was mainly driven by the food sub-item, with food sub-price growth of 1.8% in 2018, up 3.1% from-1.4% in 2017, and non-food sub-price growth of 2.2% in 2018, down slightly from 2.3% in 2017.
PPI grew 3.5% year-on-year in 2018, down from 6.3% in 2017. The average levels of PPI in the first, second, third and fourth quarters were 3.7%, 4.1%, 4.1% and 2.3%, respectively. From the perspective of month-on-month comparison, the trend of industrial product prices in 2018 is first down, then up and then down. Except for negative PPI in February, March, April, November and December, PPI in other months is positive. Structurally, the overall industrial product prices showing the above characteristics are mainly affected by the oil industry chain and the iron and steel industry, and the rapid decline in industrial product prices in these two areas in the past two months is the most important factor dragging down the recent PPI. It is worth pointing out that, like foreign trade data, PPI has also undergone very significant and rapid changes in the past two months, with a month-on-month growth rate of-0.2% in November, ending a six-month rise in prices for industrial products, and a rapid drop in PPI growth to-1.0% in December.
Looking ahead, we believe that the downward trend of the domestic and global economy and the converging output gap will determine that the price level in 2019 will not have the basis for a substantial rise, and there will be more obvious deflationary pressure in the industrial products sector. There is a high probability that oil price growth will decline in 2019, which will put direct pressure on both CPI and PPI year-on-year growth. In addition, we believe that the black price growth rate is also likely to continue to decline in 2019, mainly because: first, the demand support is insufficient. Although the growth rate of infrastructure in 2019 is likely to pick up slightly with policy support (the NDRC has also been intensively approving rail projects in the past month), from the historical trend, the correlation between rebar and real estate is obviously stronger than that of infrastructure (here, mainly before 2016). The new round of rebar price rise after 2016 is more affected by the supply side and has little correlation with both), so it may still be difficult for black demand to rebound strongly under the premise of improved infrastructure growth in 2019 but the property market continues to cool. Second, the supply contraction has weakened, and although environmental protection, as one of the three major battles, will continue to advance in the future, practices such as "all shutdowns" last year have been explicitly banned, so there is expected to be a slight relaxation on the supply side. On the wholeWe expect CPI growth to slow slightly to 1.9% year-on-year in 2019.


V. liquidity and exchange rate:Credit expansion is still not smooth.
Following the implementation of four reserve requirement cuts in 2018, the central bank cut it again in January 2019, which shows that monetary policy is obviously relatively loose. The obvious loose characteristics of monetary policy can also be seen directly from the perspective of the trend of interest rates. R007 has declined significantly since the second half of 2018: compared with 3.35% in 2017 and 3.3% in the first half of 2018, the average R007 in the second half of 2018 is only 2.75%. Since January 2019, the average R007 has been 2.52%, the lowest monthly average since the start of strong financial regulation in October 2016.
However, the significant easing in monetary policy has not led to significant credit expansion. In 2018, the growth rate of M2 remained basically stable, but the growth rate of M1 and social finance continued to decline significantly: the growth rate of the balance of social welfare in 2018 was 9.78%, which was lower than the growth rate of 13.4% in 2017, and the trend basically declined month by month. M1 only grew by 1.5% in 2018, which was significantly lower than that of 11.8% in 2017. M2 grew by 8.1% in 2018, down slightly from 9.0% in 2017. Looking ahead, the probability that the central bank will continue to cut reserve requirements in 2019 is still relatively high, but under the background that the capital constraints on banks' balance sheets, the new regulatory framework for off-balance sheet asset management still exist, real estate and infrastructure are difficult to significantly increase leverage, and the economic downturn will have a negative impact on business operations, the downturn in credit expansion is likely to continue in 2019.
In 2018, the exchange rate of RMB against the US dollar first rose, then depreciated and then rised. from the perspective of monthly average, the highest appreciation in March 2018 was 6.29, and the lowest depreciation in October 2018 was 6.96, only one step away from 7.0. Since January 2019, the average exchange rate of RMB has appreciated again to 6.78.
The trend of RMB exchange rate is greatly affected by the dollar index. Although US economic growth may decline significantly in 2019 and the Fed's interest rate hike cycle is coming to an end, we believe that the dollar index may not be too weak in 2019 for the following reasons: first, exchange rates have always been determined by comparing the relative fundamentals of two economies, not by the fundamental movements of one economy; second, the dollar has always been the most important safe-haven currency in the world. Whenever the volatility of the global economy or the turmoil in global financial markets increases, the dollar is usually favored by investors. In general, we believe that the dollar index in 2019 may neither rise nor fall sharply, but may fluctuate widely around the central level of around 95. Therefore, the external depreciation pressure on the RMB exchange rate is lower than in 2018, but it may not be reversed.
