
Simulations Plus, Inc. (NASDAQ:SLP) shareholders might be concerned after seeing the share price drop 14% in the last month. But that scarcely detracts from the really solid long term returns generated by the company over five years. In fact, the share price is 261% higher today. We think it's more important to dwell on the long term returns than the short term returns. Ultimately business performance will determine whether the stock price continues the positive long term trend.
In light of the stock dropping 9.9% in the past week, we want to investigate the longer term story, and see if fundamentals have been the driver of the company's positive five-year return.
See our latest analysis for Simulations Plus
While the efficient markets hypothesis continues to be taught by some, it has been proven that markets are over-reactive dynamic systems, and investors are not always rational. By comparing earnings per share (EPS) and share price changes over time, we can get a feel for how investor attitudes to a company have morphed over time.
During five years of share price growth, Simulations Plus achieved compound earnings per share (EPS) growth of 13% per year. This EPS growth is slower than the share price growth of 29% per year, over the same period. So it's fair to assume the market has a higher opinion of the business than it did five years ago. That's not necessarily surprising considering the five-year track record of earnings growth. This favorable sentiment is reflected in its (fairly optimistic) P/E ratio of 92.02.
The image below shows how EPS has tracked over time (if you click on the image you can see greater detail).
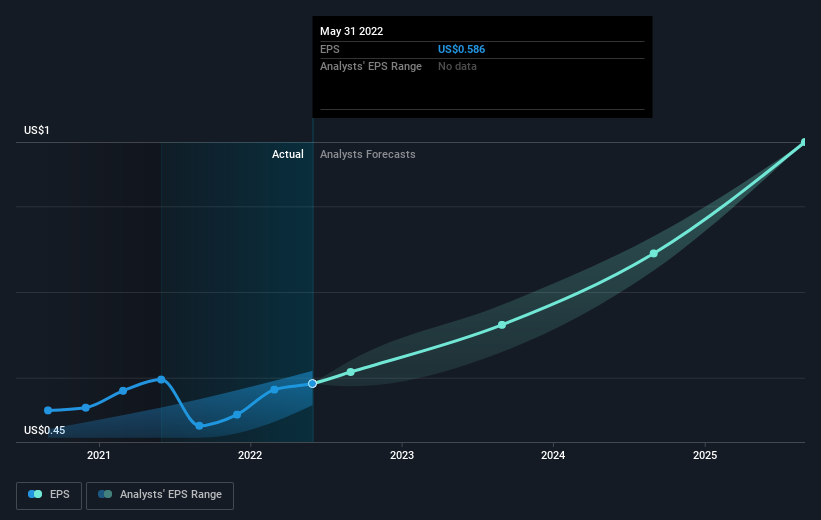 NasdaqGS:SLP Earnings Per Share Growth September 20th 2022
It's probably worth noting that the CEO is paid less than the median at similar sized companies. But while CEO remuneration is always worth checking, the really important question is whether the company can grow earnings going forward. Before buying or selling a stock, we always recommend a close examination of historic growth trends, available here..
What About Dividends?
As well as measuring the share price return, investors should also consider the total shareholder return (TSR). The TSR incorporates the value of any spin-offs or discounted capital raisings, along with any dividends, based on the assumption that the dividends are reinvested. Arguably, the TSR gives a more comprehensive picture of the return generated by a stock. We note that for Simulations Plus the TSR over the last 5 years was 276%, which is better than the share price return mentioned above. The dividends paid by the company have thusly boosted the total shareholder return.
A Different Perspective
It's nice to see that Simulations Plus shareholders have received a total shareholder return of 35% over the last year. And that does include the dividend. That's better than the annualised return of 30% over half a decade, implying that the company is doing better recently. In the best case scenario, this may hint at some real business momentum, implying that now could be a great time to delve deeper. Before spending more time on Simulations Plus it might be wise to click here to see if insiders have been buying or selling shares.
Of course Simulations Plus may not be the best stock to buy. So you may wish to see this free collection of growth stocks.
Please note, the market returns quoted in this article reflect the market weighted average returns of stocks that currently trade on US exchanges.
Have feedback on this article? Concerned about the content? Get in touch with us directly. Alternatively, email editorial-team (at) simplywallst.com.
This article by Simply Wall St is general in nature. We provide commentary based on historical data and analyst forecasts only using an unbiased methodology and our articles are not intended to be financial advice. It does not constitute a recommendation to buy or sell any stock, and does not take account of your objectives, or your financial situation. We aim to bring you long-term focused analysis driven by fundamental data. Note that our analysis may not factor in the latest price-sensitive company announcements or qualitative material. Simply Wall St has no position in any stocks mentioned.