
Legendary analyst RalphAcampora, who has the nickname "Godfather" for technical analysis, recently compared what Trump has in common with former US President Ronald Reagan. His findings may be a warning to the market.
The performance of US stocks during Reagan's tenure
Acampora, head of technology research at AltairaCapitalPartners, points out that president Reagan had a six-month honeymoon with the stock market, when u.s. stocks rose nearly 10%.
The following picture shows the performance of the Dow after Reagan took office:
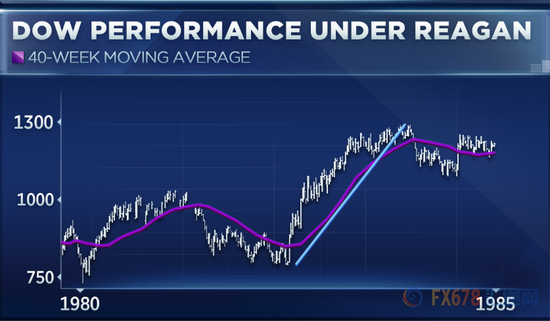
When Reagan came to power on January 20, 1981, the Dow was near 950. Until mid-1981, the index had a narrow trading range, followed by a decline. The Dow closed down 9% that year.
Acampora explained that something happens after taking office and after the honeymoon of the stock market, because the president's political plans take some time to implement. As a result, when the honeymoon period ends, these presidents will face a bear market. Most presidents encounter some difficulties in their second year in office, and President Reagan is no exception.
In the early 1980s, in order to rid the US economy of the sharp rise in inflation, the federal funds rate was raised, but this triggered a recession. The recession lasted from July 1981 to November 1982.
During the Reagan administration, the Dow fell into a bear market, falling more than 20% from a 52-week high. At one point, U. S. stocks fell as much as 24%, according to Acampora. The Dow hit bottom at 776.92 on Aug. 12, 1982.
To some extent, this marks a turning point, says Acampora. He pointed out that the new low during the Reagan administration in August 1982 was the beginning of the next long-term bull market, which lasted 18 years.
From the time Reagan was sworn in to the end of his term in January 1989, American blue chips climbed 135%, while the s & p 500 index rose 118%.
Us stocks may fall by more than 24%
Although US stocks have repeatedly fallen into or popped out of the correction zone since February, Acampora believes that the honeymoon period between Trump and US stocks still exists. Us stocks rose nearly 45 per cent from a low in November 2016 to a high in January this year. Us stocks have performed extremely well in the past 15 months.
From the Trump election to the record high at the end of January, the Dow is up 45% and the S & P 500 is up 34%.
The following picture shows the Dow theoretical Dow Jones Industrial average:
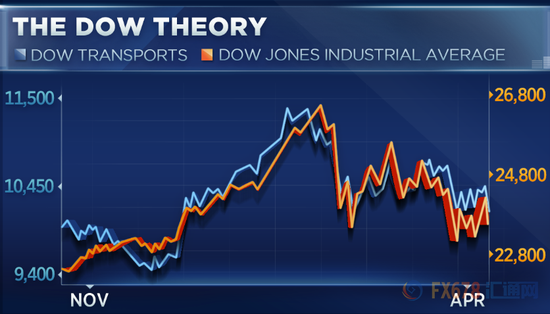
Dow theory predicts that when the Dow Jones industrial average and the Dow transport average rise at the same time or one after another, the market will be on an upward trend and vice versa.
The Dow Jones Transportation Index peaked in early January, followed by the Dow Jones Industrial average at the end of January. The Dow Jones Industrial average fell to a low in March, but the Dow Jones Transportation Index has not hit bottom since Feb. 9.
As a veteran Dow theorist, Acampora said that as long as the Dow Jones Traffic Index remains at this level, U. S. stocks will be in the correction stage, but must remain vigilant.
The worse news for Trump, Acampora points out, is that any fall in US stocks in his second year in office could be worse than Reagan's bear market. The current performance of some stocks looks very volatile, suggesting that US stocks could fall by more than 24 per cent.
The Dow and the S & P 500 are no longer in the correction zone. The Dow is down 8% from its January 26 high, while the s & p 500 is down 7% from its all-time high hit on the same day.