
Introduction: before and after the outbreak of the Sino-US trade war, there are mainly three viewpoints on the comparison of Sino-US competitiveness: 1) the overinflationist, who believes that China's comprehensive national strength has surpassed that of the United States, and that China has the strength to challenge the United States in an all-round way; 2) excessive pessimists, negating the Chinese system and culture, that the reform is difficult to move forward into the deep water area, and the gap between China and the United States will only grow wider and wider as a result of internal and external troubles. 3) the rational and objective school advocates a comprehensive, objective and rational analysis of the competitiveness of China and the United States, and believes that through further reform and opening up, it is possible for China to achieve high-quality development, continue to catch up with the United States, constantly improve people's livelihood, and move into the ranks of developed countries. How big is the gap between China and the United States? In what ways is it reflected? We will comprehensively compare the strength of China and the United States in the fields of economy, science and technology, military, education, business, and people's livelihood. This paper objectively analyzes the gap between China and the United States in terms of economic strength, affirms progress and faces up to the problem.
Economic comparison between China and the United States: China is the largest developing country, and the United States is the largest developed country.
At present, China is the second largest economy in the world, and its share of the global economy is constantly expanding, and the gap of GDP scale between China and the United States has been narrowing, but it has not changed the basic status quo that "China is the largest developing country and the United States is the largest developed country." Assuming an average annual GDP growth rate of 6% in China and 2% in the United States, China's total GDP is expected to overtake that of the United States in 2027, but there is still a large gap in per capita GDP and production efficiency. There is still much room for development compared with the United States in terms of urbanization level, industrial structure, financial freedom, and enterprise competitiveness, and the military and political influence of the United States is inferior to that of the United States. China must be based on its national conditions, look at the gap with the United States objectively and rationally, vigorously promote reform and opening up, and improve its comprehensive national strength.
1. GDP scale: China's global share is gradually expanding, and the gap between China and the United States is narrowing
The GDP gap between China and the United States is rapidly narrowing, and the total amount of GDP in China is expected to overtake that of the United States in 2027. In 2017, China's economy reached US $12.2 trillion, with an economic growth rate of 6.9%, accounting for 15% of the world's total. The size of the US economy is US $19.4 trillion, with an economic growth rate of 2.3%, accounting for 24% of the world. If China grows at a growth rate of about 6%, it is expected to become the world's largest economy around 2027.
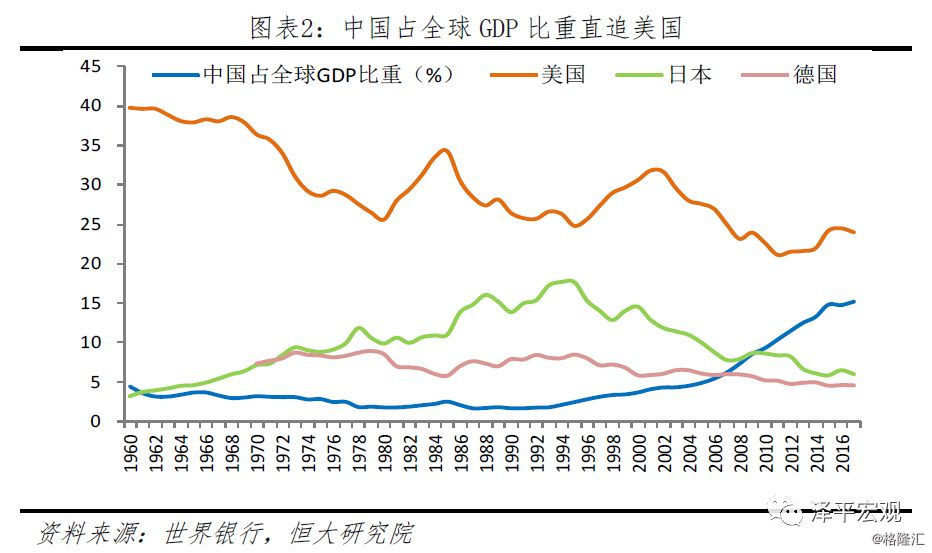
China's economy in purchasing power parity terms is already the largest in the world. The size of China's economy (measured by PPP) was $18 trillion in 2014, surpassing that of the United States for the first time, reaching $23.1 trillion in 2017 and $19.4 trillion in the United States.
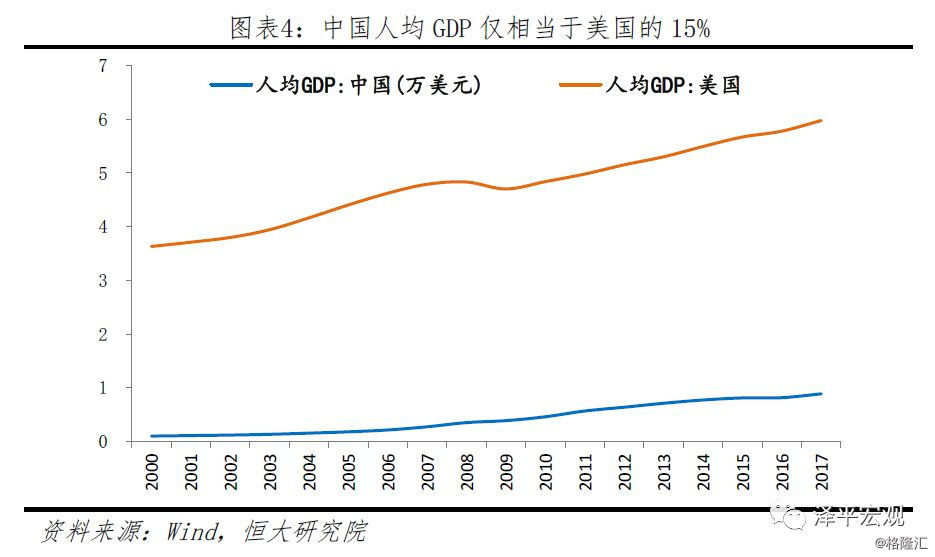
3. Economic output efficiency: China's total factor productivity and labor productivity are lower than those of the United States, and the GDP per unit of energy consumption is lower than the average level of the United States and the world.
China's economy is changing from high-speed growth to high-quality growth, which is more dependent on total factor productivity, but China's economic output efficiency is still much lower than that of the United States. In 2014, China's total factor productivity (PPP) was 43% of that of the United States; in 2017, China's labor productivity was $13000, the United States was $110000, and China was about 12% of the United States.

China's GDP creation efficiency is lower than the average level of the United States and the world, and its energy consumption is high, which is only better than that of Russia among the major countries. In 2014, the GDP per unit of energy consumption in China was 5.7USD / kg of oil equivalent, while that of the United States was 7.46USD / kg of oil equivalent, and the world average was 7.9USD / kg of oil equivalent.


The dependence of both China and the United States on imports and exports has declined, and the decline in China is even greater. China's total import and export volume / GDP has increased rapidly since it joined the WTO in 1978, reaching a peak of 64.2% in 2006, and has continued to decline since then, reaching 33.6% in 2017. The degree of dependence on imports and exports has declined, which is more than 30 percentage points lower than the peak. China's overall trade surplus in goods continued to expand, with net exports / GDP falling after reaching 7.5 per cent in 2007 and 3.5 per cent in 2017. The total volume of US imports and exports / GDP continued to increase, reaching a peak of 30.9% in 2011, and has declined in recent years to 27% in 2017. After the first negative turn in 1971, US net exports were negative in most years, with the exception of a moderation due to the trade war between Japan and the US in the late 1980s, reaching-5.5 per cent of GDP in 2006, and then narrowing the deficit to-2.8 per cent in 2017. The Sino-US trade war did not break out around 2006, when the US deficit was the most serious, but in 2018, when the deficit narrowed, it can be seen that reducing the trade deficit is only an excuse for the United States to launch a trade war.

6. Industrial structure: China's tertiary industry is 30% lower than that of the United States, but the proportion of financial industry is slightly higher than that of the United States.
The proportion of China's tertiary industry is 30 percentage points lower than that of the United States, and the service industry of the United States is absolutely dominant. In 2017, China's three major industries accounted for 8%, 40% and 52% of GDP respectively, while the three major industries in the United States accounted for 1%, 17% and 82% of GDP. In terms of labor force distribution, the proportion of employment in China's three major industries in 2017 was 27%, 28.1% and 44.9%, while that in the United States was 1.7%, 18.9% and 79.4%.


7. Finance: China is dominated by indirect financing, while the United States is dominated by direct financing. China's financial freedom ranks low in the world, the currency is seriously overissued, and the market value of stocks is about 1x4 of that of the United States. the proportion of US dollars in global foreign exchange reserves is as high as 63%.
China is dominated by indirect financing led by banks, with low risk preference, and tends to lend to state-owned enterprises and traditional low-risk industries; in the United States, direct financing is dominant, and venture capital is developed, which is conducive to promoting real economy and high-tech innovation. In 2017, China accounted for 75% of indirect financing and 25% of direct financing, while the United States accounted for 80% of direct financing and about 20% of indirect financing.
The degree of deepening of China's financial industry is not enough, the degree of freedom is low, and the degree of opening to the outside world is not enough. According to the Financial Freedom Index released by the American Association of traditional funds in 2017, China's financial freedom is 20, ranking 120th in the world, while the United States is 70th and 20th in the world.
The proportion of China's M2/GDP is 2.8 times that of the United States, and its currency is massively overissued. At the end of 2017, China's money supply (M2) was $24.8 trillion, accounting for 202.8 per cent of GDP, while the US money supply was $14 trillion, accounting for 71.4 per cent of GDP.


The total savings rate of China is higher than that of the United States, but the loan interest rate of the United States is lower than that of China, and the scale of attracting foreign investment is higher than that of China. In 2016, China's total savings rate was 47%; in the United States, the total savings rate was 18%. In July 2018, China's short-term lending rate was 4.35%, and the US federal funds rate was 1.91%. In 2017, China attracted $136.3 billion in foreign direct investment, while the United States attracted $277.3 billion in foreign direct investment. In 2017, China invested US $101.9 billion and the US invested US $424.4 billion.


10. Cities: the urbanization rate of China is 23.6 percentage points lower than that of the United States, and the agglomeration effect of urban agglomeration is lower than that of the United States.
The urbanization rate of resident population in China is lower than that in the United States, and the urbanization rate of household registration is even lower, so the process of citizenization of migrant workers should be accelerated. The agglomeration effect of China's five major urban agglomerations is lower than that of the United States. In 2017, the urbanization rate of China was 58.5% (the urbanization rate of household registration was 42.4%), and that of the United States was 82.1%. The proportion of the population of the Atlantic coastal urban agglomeration, the Great Lakes urban agglomeration and the west coast urban agglomeration in the United States is 21.8%, 14.5% and 12.1% respectively, which is higher than that of 8%, 10.9% and 5.9% of the population of Beijing-Tianjin-Hebei, Yangtze River Delta and Pearl River Delta in China. The GDP of the three major urban agglomerations in the US accounts for 25.6 per cent, 13.8 per cent and 14.1 per cent respectively, higher than 10.1 per cent, 19.8 per cent and 9.8 per cent of China's three major urban agglomerations.

11. Resources and energy reserves: China's per capita arable land and water resources are lower than those of the United States, the rate of energy self-sufficiency is declining year by year, and the proportion of energy imports is about twice that of the United States.
The area of arable land in China is 78% of that of the United States, the per capita arable land area is 19% of that of the United States, and the per capita renewable water resources are 23% of that of the United States. The rate of energy self-sufficiency is declining year by year, and the proportion of energy imports is about twice that of the United States. According to the World Bank, the cultivated land area of the United States in 2015 was 1.523 million square kilometers, accounting for 16.65 percent of the total land area, making it the country with the largest arable land area in the world, with a per capita arable land area of 0.47 hectares. The area of cultivated land in China is 1.19 million square kilometers (about 1.785 billion mu), accounting for 12.68% of the land area, with a per capita area of 0.09 hectares. The area of cultivated land and per capita cultivated land in the United States are 1.3 and 5.2 times that of China, respectively. In 2014, the per capita renewable water resources in China was 2062 cubic meters per person, equivalent to 23% of the 8846 cubic meters per person in the United States. The proportion of China's energy consumption imports has increased year by year, and the self-sufficiency rate has decreased year by year, which is in sharp contrast to that of the United States since the shale gas revolution in recent years. In 2014, China's energy import accounted for 15.02%, twice that of the United States.

13. Military spending: the United States leads the world in military spending, three times that of China.
At present, the rise of emerging countries is to a large extent as an economic power, and there is still a big gap between their political influence and military strength compared with their economic strength. According to data from the Stockholm International Peace Research Institute in Sweden, China's military spending ranked second in 2017, accounting for US $228 billion, accounting for 1.9% of GDP, while US military spending was US $695 billion, accounting for 3.6% of GDP, accounting for 40% of the world, which is three times that of China. Saudi Arabia is worth 69.4 billion US dollars, Russia 66.3 billion US dollars, India 64 billion US dollars, France 57.8 billion US dollars, Britain 47 billion US dollars and Japan 45.4 billion US dollars.