
Edited by Guojin Securities: "Ten years of great bull market in US stocks: how big is the bubble after more than three times the increase?"
Us stocks have been rising for 10 years, the Dow Jones Industrial average and the S & P 500 are up more than 300%, and the NASDAQ is up more than 500%. Is there a bubble? If so, how big is the bubble?Guojin SecuritiesThrough data comparison and scenario analysis, these questions are carefully studied and answered.
1. How is the bubble formed? The loose monetary expansion policy in the past decade has caused asset prices to exceed their intrinsic value and form a bubble.
After the 2008 financial crisis, the United States adopted loose monetary policy (interest rate cut + QE) + active fiscal policy (widening fiscal deficit), which contributed to a sharp rise in asset prices.
The Federal Reserve slashed interest rates
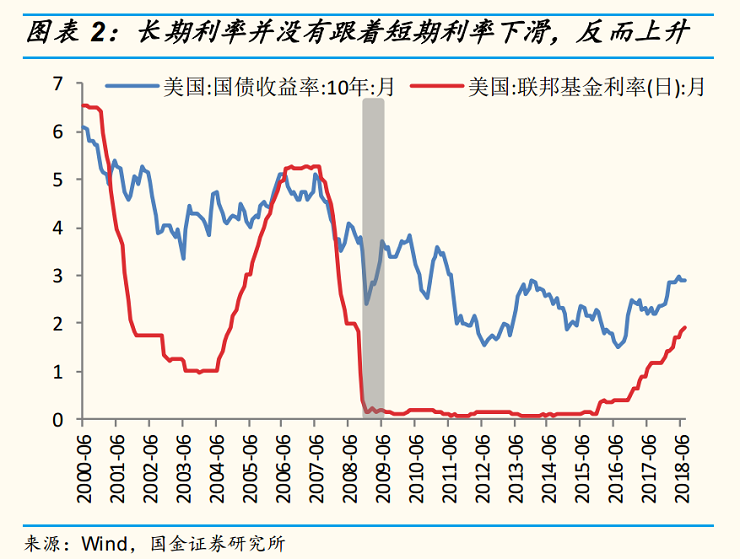
In order to deal with the negative effects of the subprime crisis, the Federal Reserve began to cut interest rates, but at this time, the medium-and long-term interest rates did not fall to the corresponding level with the short-end interest rates, but continue to rise.
The rise in medium-and long-end yields has led to the rise of other interest rates, rising interest rates on commercial loans and high interest rates on household mortgages, dragging down the recovery of the real estate market and preventing the recovery of capital expenditure and the economy. the effectiveness of the transmission of conventional monetary policy declined during the crisis.
Fed's "quantitative easing" policy (QE)
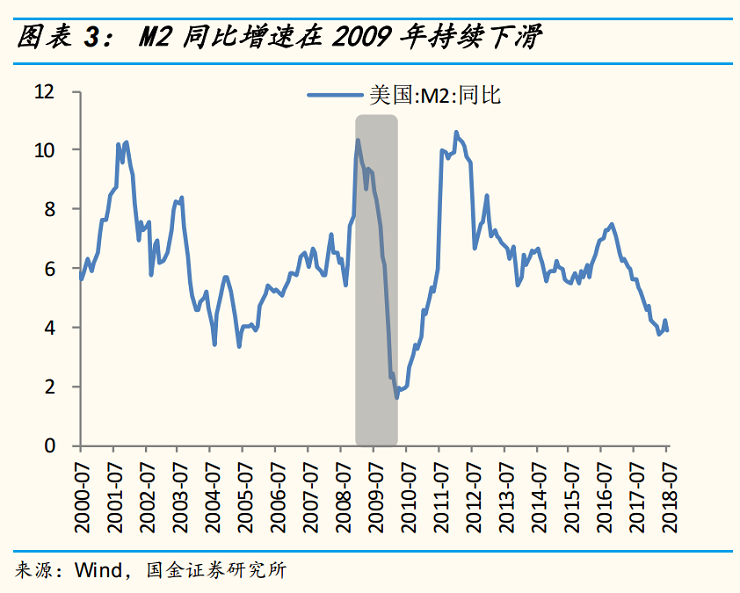
During the financial crisis, although the year-on-year growth rate of base money was about 113% in May 2009, the money multiplier grew by-46% year-on-year, resulting in M2 money supply growth still significantly lower than the historical average.
In the case of declining monetary multiplier effect and increased financial uncertainty, although the Federal Reserve and the Treasury have injected huge amounts of money into the banking system, banks are more willing to put this money into the Federal Reserve in the form of excess reserves. leading to a factual credit contraction.
As a result, the Fed launched an unconventional monetary policy, "quantitative easing", to deal with the passive decline in liquidity during the financial crisis.
The expansionary fiscal policy of the United States government
Data show that from October 2008 to June 2009, federal revenue was $1.589 trillion, while simultaneous spending more than tripled from the same period in 2008 to $2.675 trillion.

Since the Fed's monetary policy goal is to control inflation as the primary goal, the Fed has not responded to the rapid rise in asset prices over the past decade, even cutting interest rates during the period of asset bubble inflation, inadvertently creating sufficient "room for expansion" for the expansion of asset bubbles.
Guojin Securities believes thatThe asset boom fuelled by Fed intervention is most likely to be an unsustainable bubble rather than a real boom. When the Fed begins to withdraw from loose monetary policy until interest rates are finally raised and tightened, the bubble is likely to burst more violently, leading to greater financial instability and recession.

Compared with the 2008 real estate bubble and the current bubble formation, the federal funds rate is much lower than the Taylor rule model, indicating that the current monetary policy may indeed be too loose, accumulating a large number of bubbles. And in terms of the extent and duration of the federal funds rate below the Taylor rule, the current duration is longer and larger, which means that the current bubble is longer and more likely to accumulate.


2. Guojin Securities judges from three indicators + three angles that there is indeed a large number of bubbles in US stocks, and the bubble is close to its peak.
The marginal margin ratio of US stocks to GDP is too high.
When margin debt levels reach extreme levels, it often indicates that market sentiment is too optimistic, heralding a correction or a bear market. During the dotcom and real estate bubbles, margin debt peaked at about 2.75% of GDP. In the current stock market bubble, marginal margin debt is close to 3 per cent of GDP.

CAPE of US stocks is too high and dividend yield is too low
Usually, the CAPE of US stocks is close to the bottom at about 5 to 6 times, and more than 25 times into a frenzy of "irrational exuberance". On the eve of the bursting of the dotcom bubble in 2000, this figure was as high as 44.2 times. The current CAPE data show that it is now about 31 times higher, which means that when market valuations reach extremes, a return to the mean is inevitable, indicating that it is already in a relatively overvalued area that requires high vigilance.

In addition, the dividend yield of the S & P 500 also confirms the market's overvaluation of the stock market. When stock market valuations are very high, dividend yields are low, and vice versa. Dividend yields have been at their lowest level in more than a century for the past two decades or so.

The ratio of total market capitalization to GDP of US stocks is too high.
When the indicator is in the range of 70% to 80%, it is time to buy. But when it's over 100%, it's time to hit the brakes. During the dotcom bubble, the index was as high as 140%; during the subprime crisis, it was also above the tipping point; it is currently above the peak of the dotcom bubble and is within the alert range.

From the point of view of the transaction structure, the rising potential of share prices brought about by buybacks is declining.
Large-scale share buybacks mean artificially propping up the market and suppressing volatility. This means that the latter part of the 2009-2017 bull market in US stocks may be a valuation illusion based on buybacks, so the potential of the market is downside.

From the perspective of enterprise structure, the technology stock FANNG leads the market, and the bubble is worrying.
This means that there is no broad force of health behind the bull market and that risk is more concentrated. Under regulation, the long-term growth prospects of technology companies such as Facebook Inc are unclear, while S & P's upcoming composition reclassification "represents the second biggest risk facing the technology industry".
From the perspective of the change of investment mode, the rise of passive investment will form a positive feedback to the trend.
As u.s. stocks have risen 322% since 2009, more than $2 trillion has flowed from active investment products into passive investment products, helping to inflate the bubble in u.s. stocks.
If a bubble is forming, when may it burst? Please look forward to revealing the next issue of Futu Research.
For more wonderful content, please mark: the past period of the rich way research election.