
Analysts at Bank of America Merrill Lynch say the journey of the bull market in US stocks may be far from over.
This month, the US stock market withstood the panic caused by trade disputes and the Turkish currency crisis and continued to rise steadily, offsetting the weakness in August. Instead, the market is preparing to celebrate the bull market in US stocks, at least in part, as the longest bull market on record, with the three major US stock market indices up more than 1 per cent so far this month.
However, the remarkable performance has triggered some nervousness, with some wondering whether the upward action of the market is about to fade.
But Sutmeier, a technical research analyst at Bank of America Merrill Lynch, remains optimistic about the market outlook.
Sutmeier said that the current width of the US stock market, the composite rise-fall line of the S & P 500 index on the New York Stock Exchange last week, reached a record high, indicating that the stock market still has a long way to go before it turns down.
"this shows that the market is changing, but not reaching the top of the market," Sutmeier said. given the debate about the peak of growth relative to value, we found it interesting that both the Russell 1000 and the Russell 1000 hit new highs last week. "
Sutmeier is referring to a very popular and hitherto lucrative investment strategy that focuses on growth stocks rather than those considered relatively cheap.
According to FactSet, the Russell 1000 growth index has risen 329% since march 2009, while the Russell 1000 value index has risen 215%.
The gains in the Dow Jones Industrial average and the Dow Jones Transportation average mean that the stock market is stronger. Dow Jones Index theory also shows that although the bull market has been going on for a long time, the bull market is still strong.
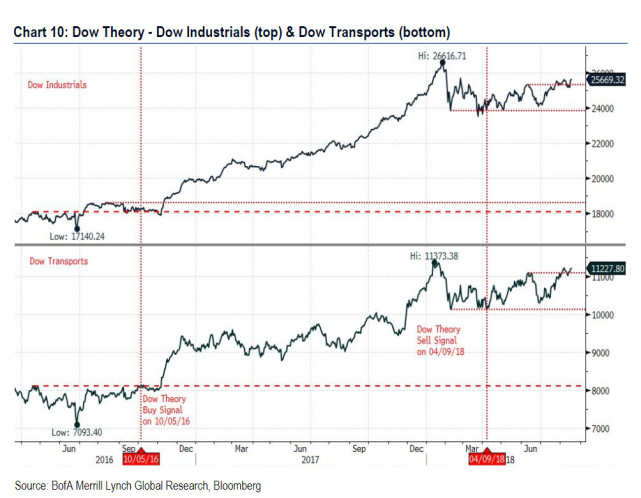
"Dow Theory confirmed its buy signal on Friday, with the Dow Jones Industrial average and the Dow Jones Traffic Index hitting new lows in February, April and June," Sutmeier said. "
The market is also encouraged by the volatile background. The technical analyst said the CBOE three-month volatility index and the Chicago Board options Exchange volatility index (VIX) remain at 1.10, which is the key support. As long as the ratio stays above 1.10, the S & P is likely to break through 2800 and hit a new high.
The relative strength of the US stock market relative to the rest of the world is another positive factor, with the daily rise and fall lines of the world's 73-country index showing signs of peaking. In previous cases, the US tends to outperform foreign markets when it weakens globally.
Looking ahead, even if the technical side of the market deteriorates and the S & P 500 is in trouble, its ability to find potential support or buying interest between 2831 and 2827 will determine whether it can reach 3000 by 2019.
Fundamentally, the strong financial performance of the US stock market may be due to the tenacity of the company. 86% of companies in the s & p 500 reported quarterly results, with second-quarter earnings up more than 24% from a year earlier, while sales were up more than 9% from a year earlier.
It is worth noting that Bank of America Corporation's barometer-including bull and bear market indices and selling indices-does not point to the top of the market.
Meanwhile, O'Hara, chief marketing technician at MKM Partners, says sentiment is just right-neither too hot nor too cold.
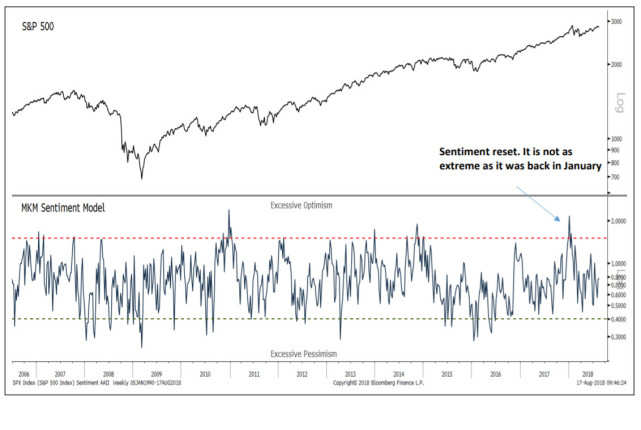
When the S & P 500 approached its January high, we found that the mood was not as excessive as it was then. Through the long, short and neutral investments in the survey of US stock investors, we can see that our emotional model is still in the neutral zone.
Us stocks extended gains for a third session on Monday, with the s & p 500 just 0.5 per cent below the record set on January 26th. (midsummer)